
- Moving the markets
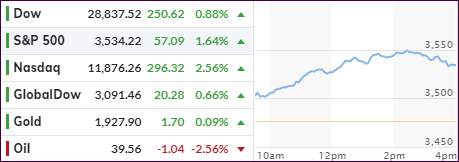
The futures already indicated this day to be one for the bulls, as renewed stimulus hopes, the upcoming earnings season and just general market optimism formed the basis for another day of levitation with especially the Nasdaq receiving a nice boost of +2.6% thanks to a massive melt-up squeeze.
It was the tech sector’s best day since September 9, when it rallied +2.7%.
Added ZH:
On the stimulus front, Nancy Pelosi and Steven Mnuchin were expected to (what else) talk more this week about an economic stimulus plan. Still, even if they manage to strike a deal, there’s almost no chance of getting legislation written and passed by Congress before the election. “There is not a denying of the fact that investors would appreciate easier accessibility to cash and cheaper cash as a result of even more stimulus,” said Jameel Ahmad, director of investment strategy at Naga Group AG in London, also pointing out the obvious.
This most recent ramp has moved the S&P 500 within striking distance of some 50 points of taking out its September 2nd all-time high of 3,581.
On the other hand, reality had nothing to do with today’s bullish theme. Pelosi rejected the White House offer, bond markets were closed, the Fed was quiet, and MSM focused on the Supreme Court justice hearings.
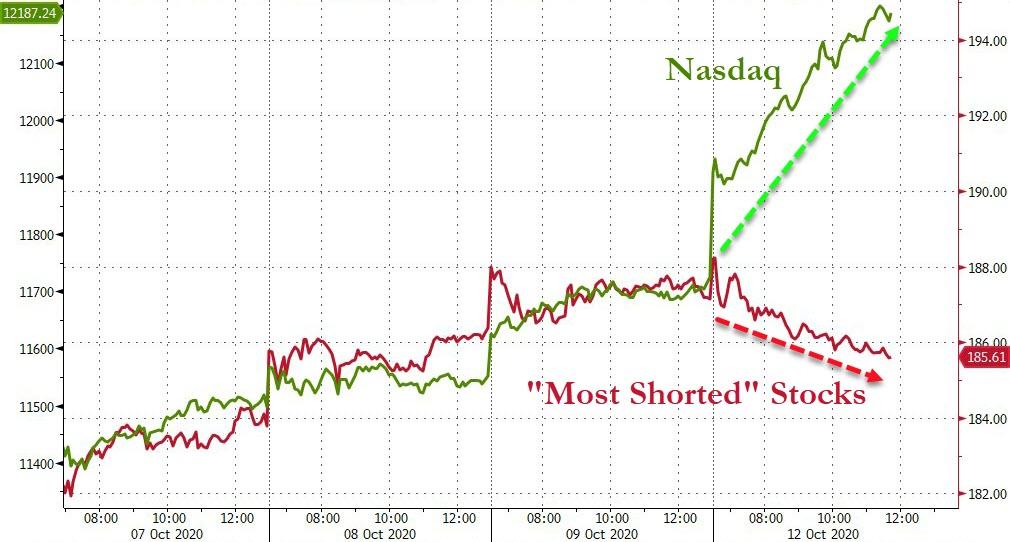
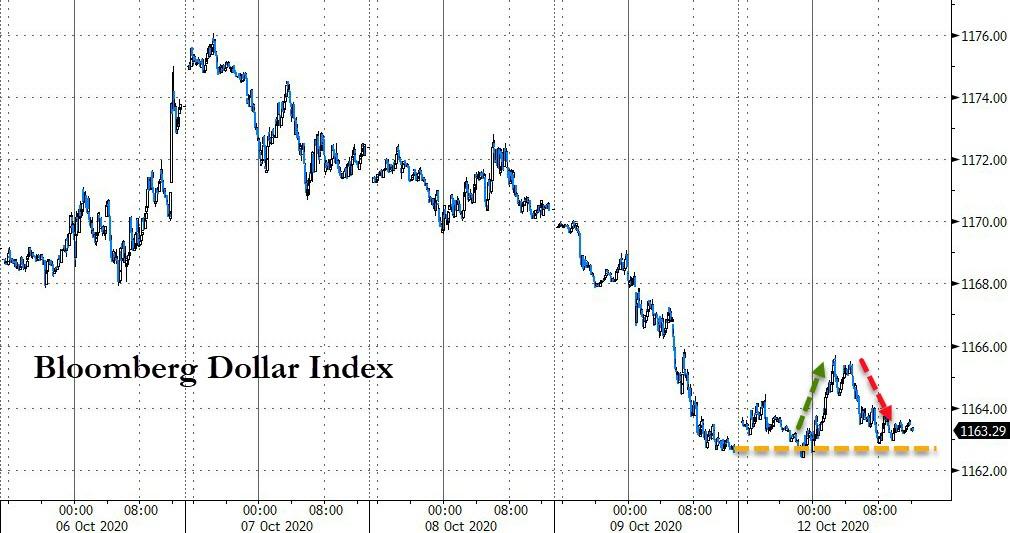
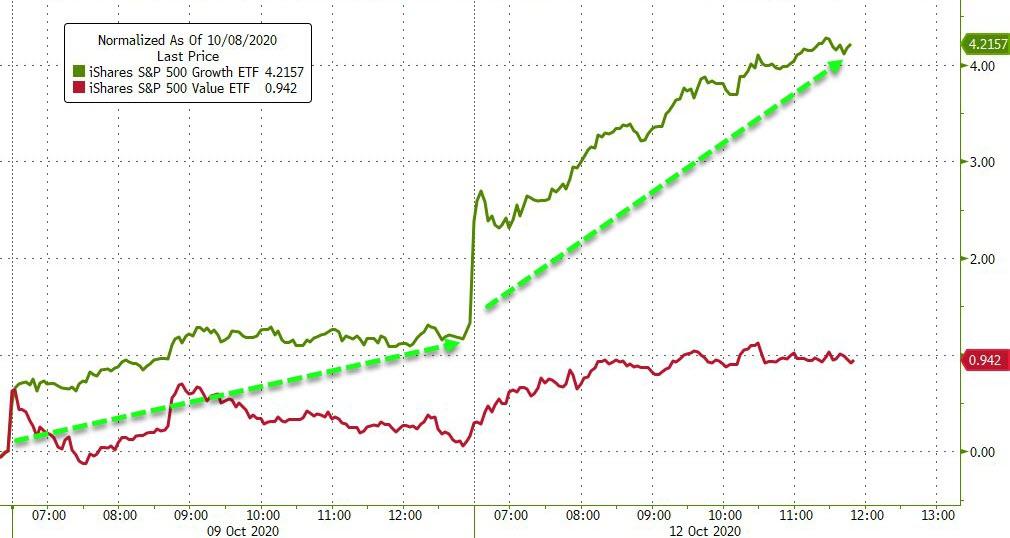
The US Dollar whipsawed and ended unchanged, while growth stocks outperformed value for the second day in a row, as ZH remarked.
Though it was a wild day, it went in favor of the bullish crowed, while the bears got mauled and now have some serious thinking to do.
2. ETFs in the Spotlight
In case you missed the announcement and description of this section, you can read it here again.
It features some of the 10 broadly diversified domestic and sector ETFs from my HighVolume list as posted every Saturday. Furthermore, they are screened for the lowest MaxDD% number meaning they have been showing better resistance to temporary sell offs than all others over the past year.
The below table simply demonstrates the magnitude with which these ETFs are fluctuating above or below their respective individual trend lines (%+/-M/A). A break below, represented by a negative number, shows weakness, while a break above, represented by a positive percentage, shows strength.
For hundreds of ETF choices, be sure to reference Thursday’s StatSheet.
For this current domestic “Buy” cycle, here’s how some our candidates have fared:
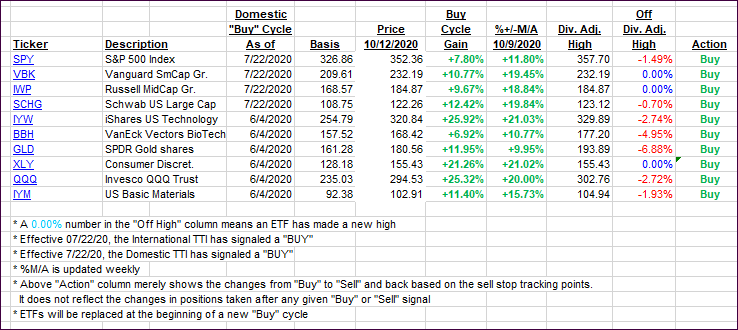
Click image to enlarge
Again, the %+/-M/A column above shows the position of the various ETFs in relation to their respective long-term trend lines, while the trailing sell stops are being tracked in the “Off High” column. The “Action” column will signal a “Sell” once the -8% point has been taken out in the “Off High” column. For more volatile sector ETFs, the trigger point is -10%.
3. Trend Tracking Indexes (TTIs)
Our TTIs jumped again as the bullish theme prevailed.
This is how we closed 10/12/2020:
Domestic TTI: +11.80% above its M/A (prior close +10.95%)—Buy signal effective 07/22/2020
International TTI: +7.74% above its M/A (prior close +7.11%)—Buy signal effective 07/22/2020
Disclosure: I am obliged to inform you that I, as well as my advisory clients, own some of the ETFs listed in the above table. Furthermore, they do not represent a specific investment recommendation for you, they merely show which ETFs from the universe I track are falling within the specified guidelines.
Contact Ulli