
- Moving the markets
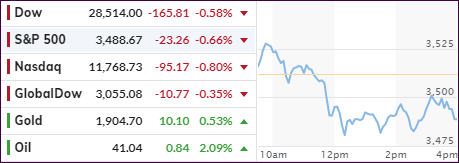
Even though the markets started the session on the plus side, early enthusiasm waned, and the major indexes closed in the red for the second day in a row. The losses were modest, and a late day rebound attempt failed to push equities back above the unchanged line.
Weakness appeared to accelerate after Treasury Secretary Mnuchin threw cold water on hopes of a coronavirus stimulus deal being reached prior to the elections.
Added CNBC:
Mnuchin said around midday that getting a deal done before the election would be difficult, adding that both sides were still far apart on certain issues. He also noted, however, that Democrats and Republicans are making progress in some areas.
The latest earnings reports turned out ok with Goldman Sachs beating expectations, while BofA’s report cart received mixed reviews sending the financial sector south, as Bloomberg shows here.
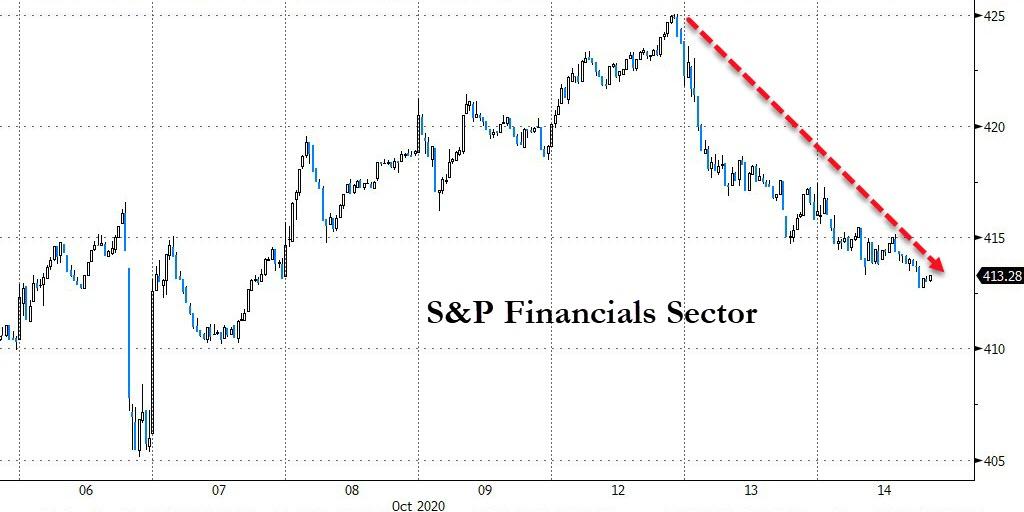
The US Dollar index did an about face and dropped, thereby giving gold a reason to rally with the precious metal gaining +0.53%.
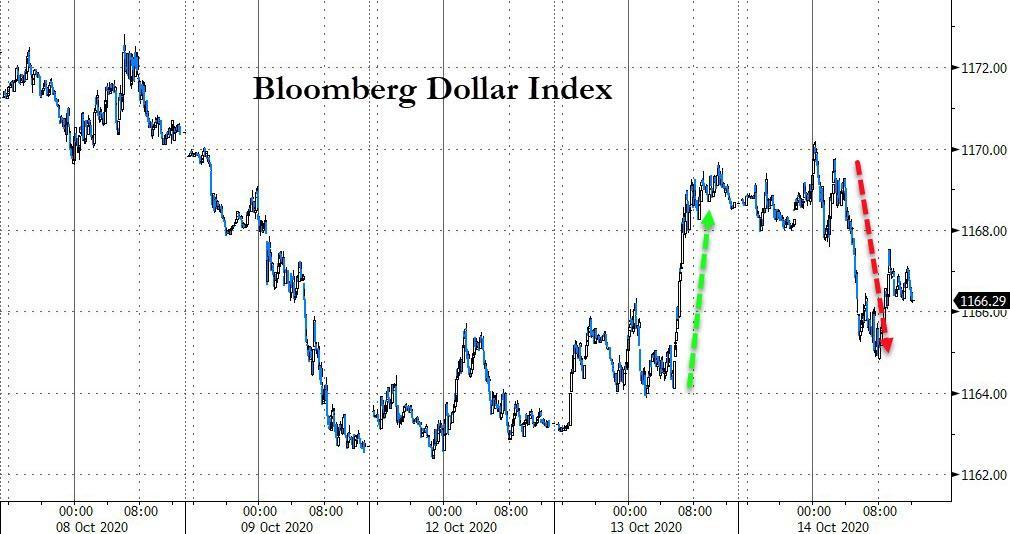
The overall feeling in the markets seems to be one of uncertainty with a “let’s wait and see” attitude prevailing in both bullish and bearish camps.
However, analyst Sven Henrich was spot is with this observation:
The bull case: Nothing matters.
Not debt, not growth, not earnings, not layoffs, not valuations, not forward multiples, not tax hikes.
Keep buying historic valuations because the magic money fairy will keep bailing us out.
I could not have said it any better.
2. ETFs in the Spotlight
In case you missed the announcement and description of this section, you can read it here again.
It features some of the 10 broadly diversified domestic and sector ETFs from my HighVolume list as posted every Saturday. Furthermore, they are screened for the lowest MaxDD% number meaning they have been showing better resistance to temporary sell offs than all others over the past year.
The below table simply demonstrates the magnitude with which these ETFs are fluctuating above or below their respective individual trend lines (%+/-M/A). A break below, represented by a negative number, shows weakness, while a break above, represented by a positive percentage, shows strength.
For hundreds of ETF choices, be sure to reference Thursday’s StatSheet.
For this current domestic “Buy” cycle, here’s how some our candidates have fared:
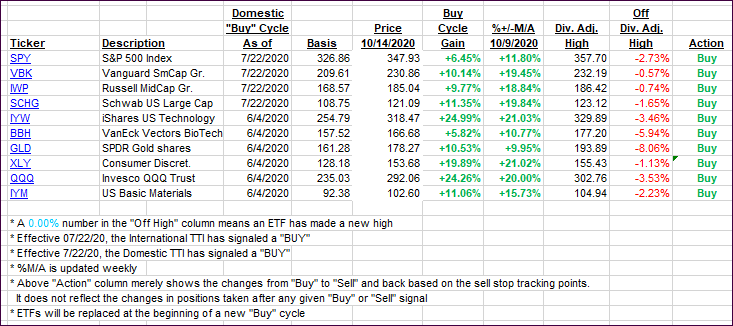
Click image to enlarge
Again, the %+/-M/A column above shows the position of the various ETFs in relation to their respective long-term trend lines, while the trailing sell stops are being tracked in the “Off High” column. The “Action” column will signal a “Sell” once the -8% point has been taken out in the “Off High” column. For more volatile sector ETFs, the trigger point is -10%.
3. Trend Tracking Indexes (TTIs)
Our TTIs retreated a tad as weakness continued.
This is how we closed 10/14/2020:
Domestic TTI: +10.38% above its M/A (prior close +10.68%)—Buy signal effective 07/22/2020
International TTI: +6.47% above its M/A (prior close +6.83%)—Buy signal effective 07/22/2020
Disclosure: I am obliged to inform you that I, as well as my advisory clients, own some of the ETFs listed in the above table. Furthermore, they do not represent a specific investment recommendation for you, they merely show which ETFs from the universe I track are falling within the specified guidelines.
Contact Ulli