
- Moving the markets
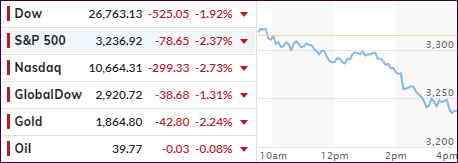
After equities appeared to have found some footing yesterday, resulting in a short bounce this morning, it was all downhill afterwards with the Nasdaq leading the charge into the red, as September’s struggles continued.
Added CNBC:
The S&P 500 and Dow are down 7.5% and 5.9%, respectively, for the month. The Nasdaq has dropped 9.7% over that time period. Shares of Facebook, Amazon, Apple, Netflix, Alphabet and Microsoft are all down at least 11% in September.
The fallout from the coronavirus persists with the UK announcing that they will be shutting down again, but President Trump confirmed the U.S. “would not be implementing a second round of lockdowns.”
On the stimulus front, the battles go on with the warring parties not having gotten any closer to agreeing on a mutually acceptable package. Despite Fed head Powell stating before Congress “that further fiscal stimulus is needed for the U.S. recovery to continue,” politics seems to reign over economic necessities.
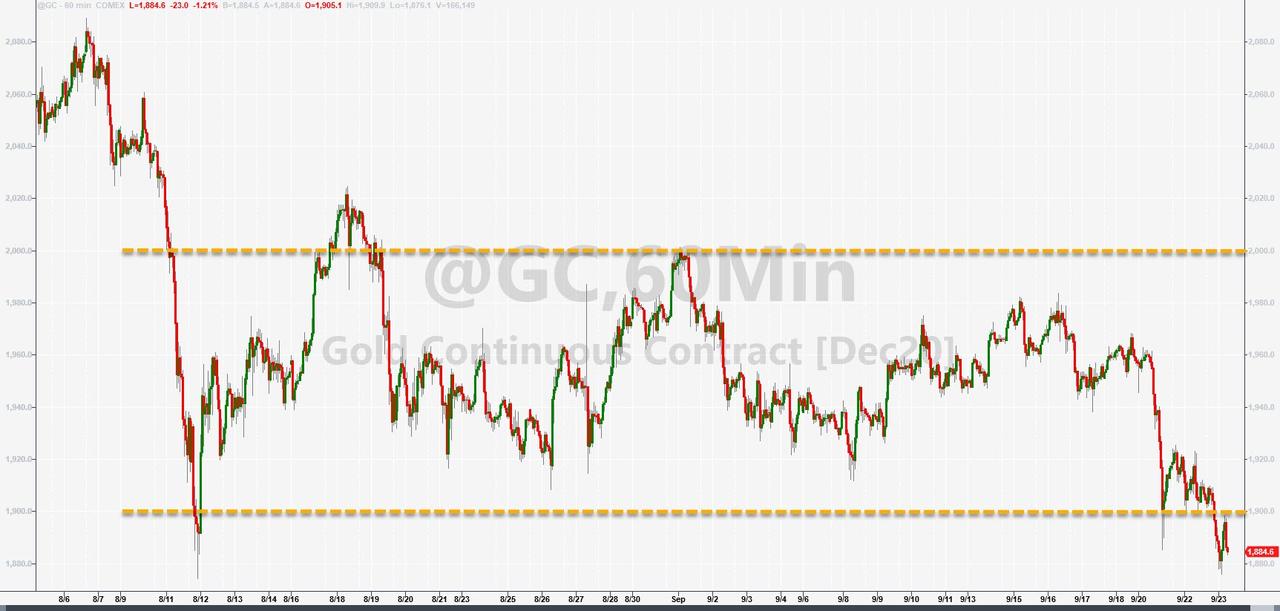
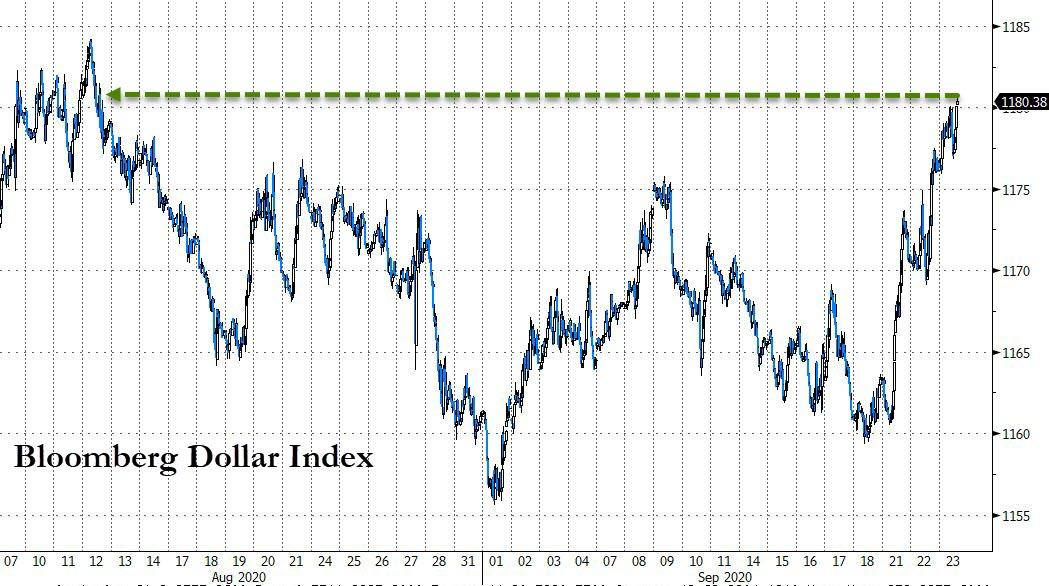
In the process of today’s broad-based sell-off, gold got slammed again thereby losing its $1,900 level, as the US Dollar surged and reached a 2-month high while also breaking its 50-day M/A to the upside.
While most of the FedSpeak today was bearish on growth in the absence of any fiscal stimulus, tomorrow’s line up of Fed Speakers may be a show to watch. Here’s their agenda. With that in mind, ZH quipped that today’s market dump may have been simply a message to the Fed: “Get back to work!”
2. ETFs in the Spotlight
In case you missed the announcement and description of this section, you can read it here again.
It features some of the 10 broadly diversified domestic and sector ETFs from my HighVolume list as posted every Saturday. Furthermore, they are screened for the lowest MaxDD% number meaning they have been showing better resistance to temporary sell offs than all others over the past year.
The below table simply demonstrates the magnitude with which these ETFs are fluctuating above or below their respective individual trend lines (%+/-M/A). A break below, represented by a negative number, shows weakness, while a break above, represented by a positive percentage, shows strength.
For hundreds of ETF choices, be sure to reference Thursday’s StatSheet.
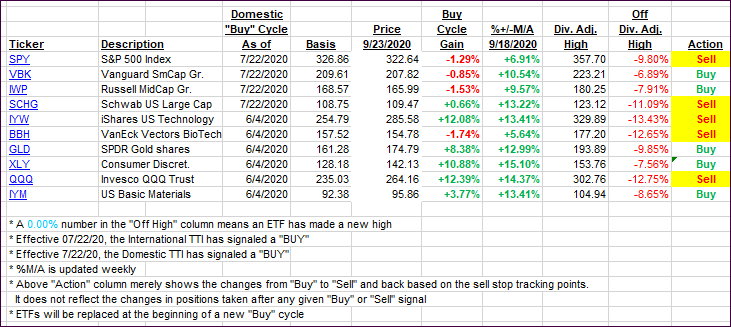
For this current domestic “Buy” cycle, here’s how some our candidates have fared:
Click image to enlarge
Again, the %+/-M/A column above shows the position of the various ETFs in relation to their respective long-term trend lines, while the trailing sell stops are being tracked in the “Off High” column. The “Action” column will signal a “Sell” once the -8% point has been taken out in the “Off High” column. For more volatile sector ETFs, the trigger point is -10%.
3. Trend Tracking Indexes (TTIs)
Our TTIs lost upward momentum as well and seem to be heading towards their long-term trend lines. Another pullback along the lines of what we saw today and sell signals will likely be triggered. I would not be surprised to see that happen by next week.
This is how we closed 09/23/2020:
Domestic TTI: +1.58% above its M/A (prior close +3.81%)—Buy signal effective 07/22/2020
International TTI: +1.03% above its M/A (prior close +2.38%)—Buy signal effective 07/22/2020
Disclosure: I am obliged to inform you that I, as well as my advisory clients, own some of the ETFs listed in the above table. Furthermore, they do not represent a specific investment recommendation for you, they merely show which ETFs from the universe I track are falling within the specified guidelines.
Contact Ulli