
- Moving the markets
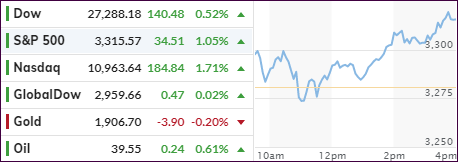
Despite staggering around their respective unchanged lines for most of the session, a mid-day burst propelled the major indexes solidly into the green with the Nasdaq leading the charge.
The S&P 500 snapped a 4-day losing streak supported by soothing words from the Fed:
Traders also digested remarks by Federal Reserve Chairman Jerome Powell, who reiterated the central bank will support the economy “for as long as it takes.” Powell added that, while the path forward “continues to be highly uncertain,” economic activity has “picked up.”
However, the jury is still out as to whether this is the “beginning of the end of the selloff,” as Jim Cramer calls it, or is there more wisdom in the words of billionaire Barry Diller that “it’s time to raise some cash?”
While nobody knows for sure, in these times of great uncertainty, I am personally more in alignment with Barry. After all, the downside risk can be huge, but on the upside, you merely give up a few percentage points by re-entering at a later but much safer time frame.
Others seem to agree:
“Some money is being taken off the table pre-election, and as we approach elections in the next six weeks I think there will be more of this happening,” Saed Abukarsh, senior executive officer at Ark Capital Management Dubai Ltd., told Bloomberg Television. “We’re now consolidating into a lower range in the S&P.”
Of course, the coronavirus and its potential vaccines, the SCOTUS nomination and uncertainty around the election continue to be headlines which, depending on any outcomes, could swing markets in either direction.
Technically speaking, all the major indexes remain stuck below their respective 50-day M/As but were helped into the green by another short-squeeze, the best tool available to rescue a sinking ship. Today was no exception, as Bloomberg’s chart shows.
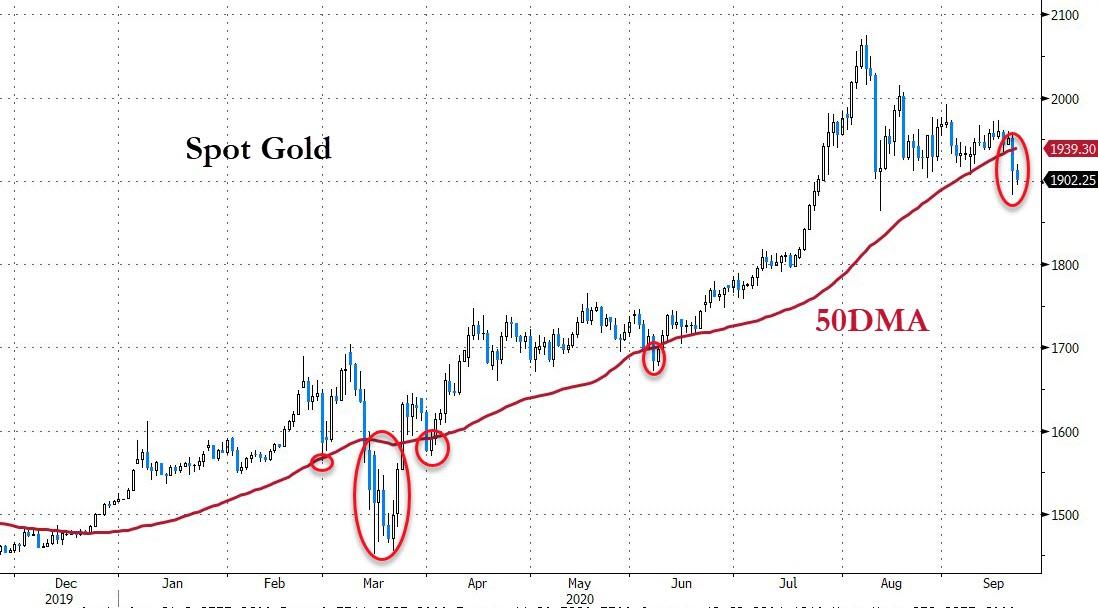
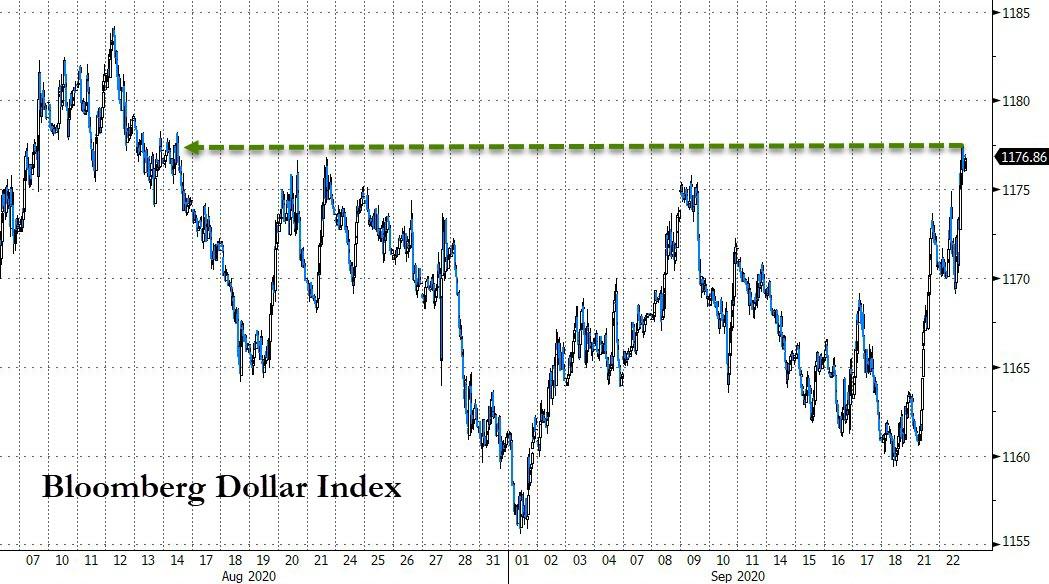
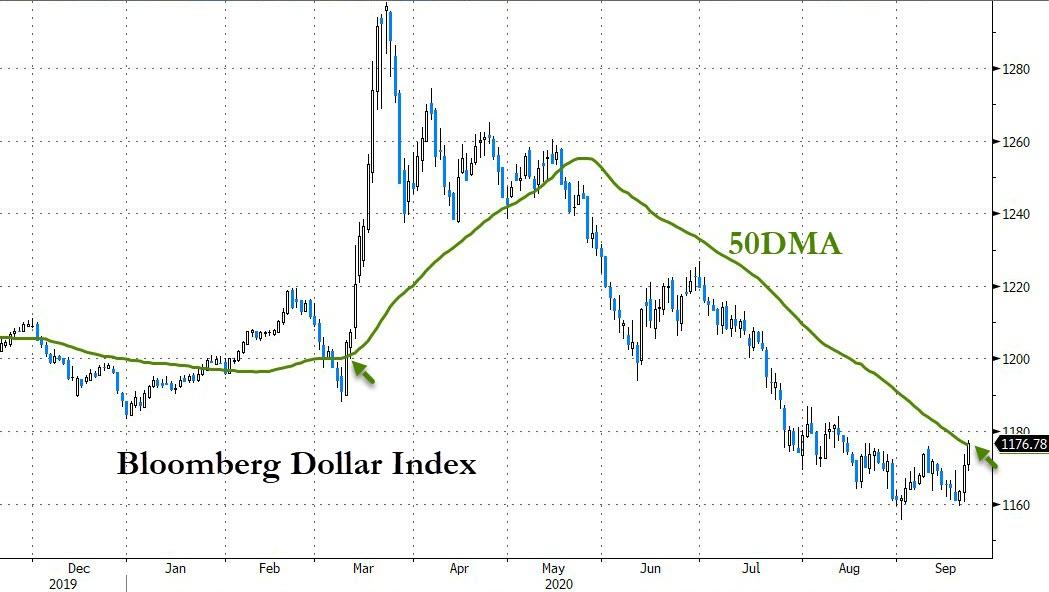
Not helping Gold was the US dollar, which not only ripped higher after yesterday’s bounce but also managed to break its 50-day M/A to the upside.
2. ETFs in the Spotlight
In case you missed the announcement and description of this section, you can read it here again.
It features some of the 10 broadly diversified domestic and sector ETFs from my HighVolume list as posted every Saturday. Furthermore, they are screened for the lowest MaxDD% number meaning they have been showing better resistance to temporary sell offs than all others over the past year.
The below table simply demonstrates the magnitude with which these ETFs are fluctuating above or below their respective individual trend lines (%+/-M/A). A break below, represented by a negative number, shows weakness, while a break above, represented by a positive percentage, shows strength.
For hundreds of ETF choices, be sure to reference Thursday’s StatSheet.
For this current domestic “Buy” cycle, here’s how some our candidates have fared:
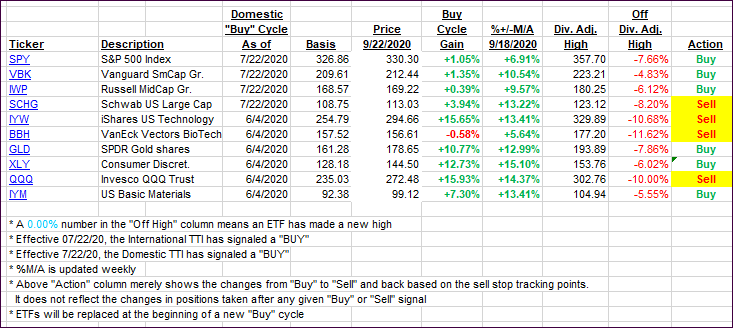
Click image to enlarge
Again, the %+/-M/A column above shows the position of the various ETFs in relation to their respective long-term trend lines, while the trailing sell stops are being tracked in the “Off High” column. The “Action” column will signal a “Sell” once the -8% point has been taken out in the “Off High” column. For more volatile sector ETFs, the trigger point is -10%.
3. Trend Tracking Indexes (TTIs)
Our TTIs were mixed with the International one slipping while the Domestic one receovered.
This is how we closed 09/22/2020:
Domestic TTI: +3.81% above its M/A (prior close +3.33%)—Buy signal effective 07/22/2020
International TTI: +2.38% above its M/A (prior close +2.42%)—Buy signal effective 07/22/2020
Disclosure: I am obliged to inform you that I, as well as my advisory clients, own some of the ETFs listed in the above table. Furthermore, they do not represent a specific investment recommendation for you, they merely show which ETFs from the universe I track are falling within the specified guidelines.
Contact Ulli