
- Moving the markets
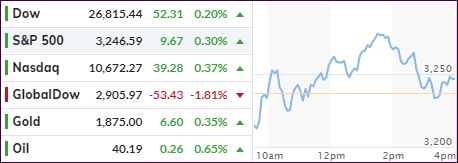
The whipsaw moves in the major indexes continued with utter abandon when, after a nice rebound high for the session, markets hit a glass ceiling and tumbled back into the red.
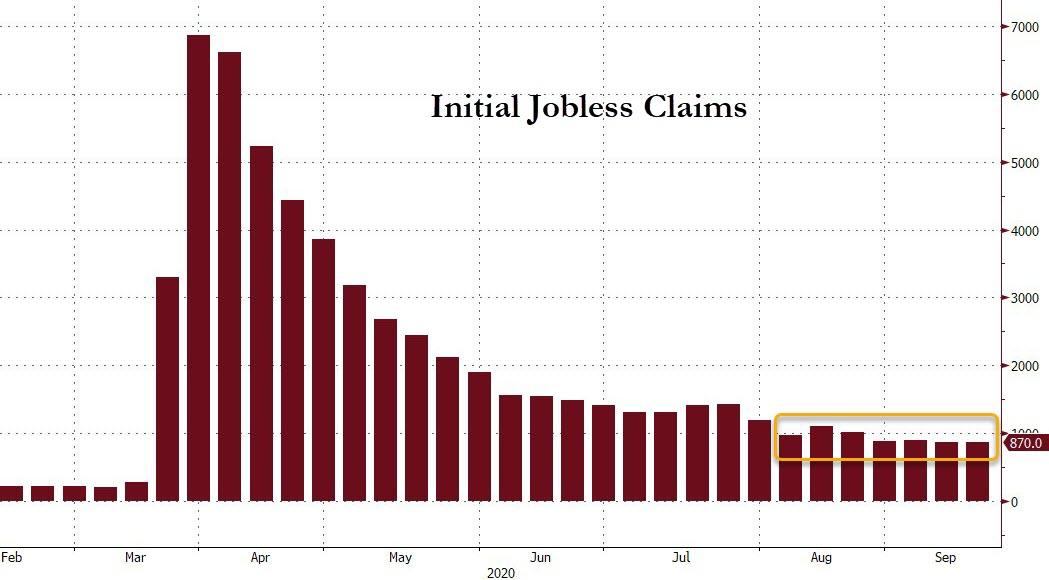
Traders were on edge early on when the futures failed to recover from Wednesday’s spanking, as a host of Fed speakers urged further fiscal stimulus, especially in view of the fact that another 870k Americans filed for first-time unemployment benefits—over the last week.
These claims have been steady, unfortunately, and remain at a pace that is four times the pre-Covid-lockdown average. Despite some pundits seeing a light of the end of the tunnel, it certainly does not look like anything resembling a V-shape type of recovery.
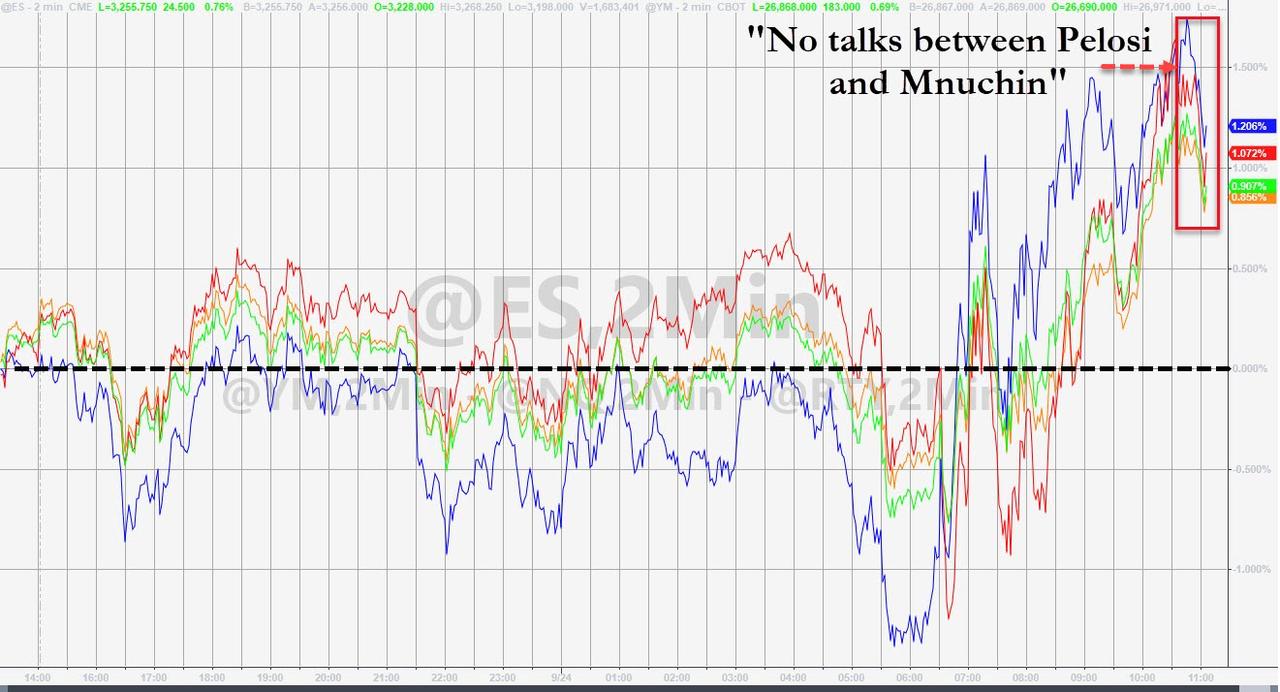
The mid-day reversal was caused by news that “no talks” were scheduled between Mnuchin and Pelosi, killing early speculation that a new round of economic stimulus talks were about to resume.
ZH summed up the dilemma like this:
Alas, that does not answer the $64 trillion question: who will blink first, Powell or Pelosi, and linked to that: what is the strike price of the Pelosi Put? In other words, does the S&P have to drop much more before the top House Democrat agrees to the republican bid of a $1.5 trillion stimulus, or will she hold out for the $2.2 trillion Democrat ask, no matter where the stock market is. That said, one would assume that Democrats would be delighted to see a stock market crash ahead of the election: after all, Trump has repeatedly confirmed that he views stocks as the only “objective” barometer of his administration, which is Democrats would be delighted if said barometer were to be much, much lower.
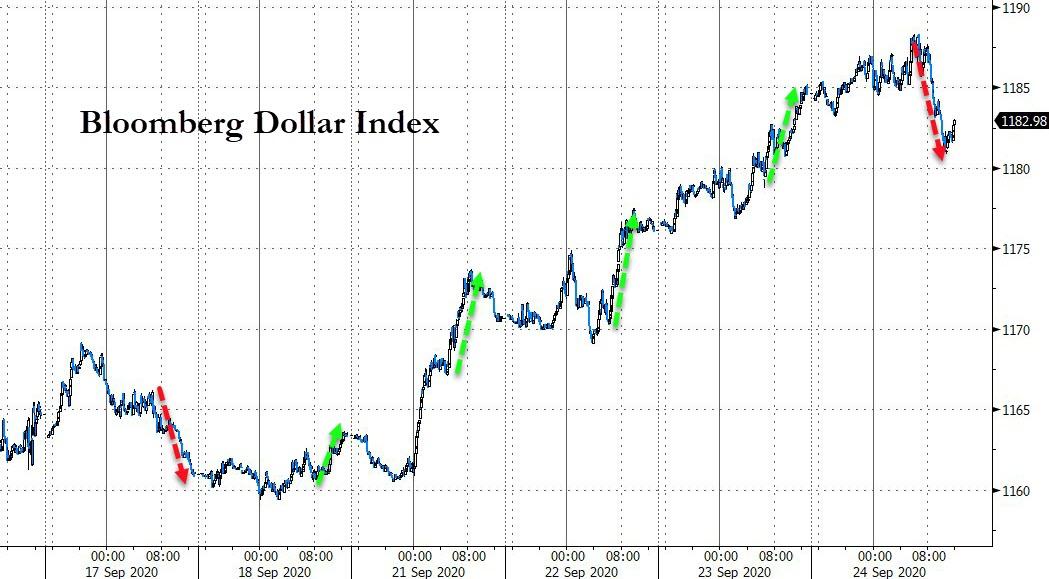
Helping the markets and precious metals to remain in a more upbeat mood was the US Dollar, which ended not only a 4-day win streak but also its biggest surge since March.
And again, when looking at the big picture, we can see that the analog to 1929 still holds:
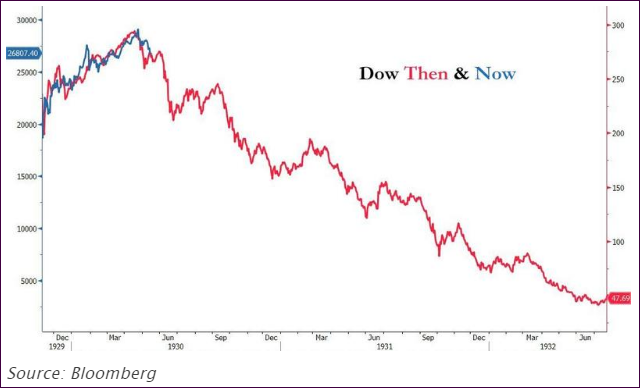
Will history really repeat itself?
2. ETFs in the Spotlight
In case you missed the announcement and description of this section, you can read it here again.
It features some of the 10 broadly diversified domestic and sector ETFs from my HighVolume list as posted every Saturday. Furthermore, they are screened for the lowest MaxDD% number meaning they have been showing better resistance to temporary sell offs than all others over the past year.
The below table simply demonstrates the magnitude with which these ETFs are fluctuating above or below their respective individual trend lines (%+/-M/A). A break below, represented by a negative number, shows weakness, while a break above, represented by a positive percentage, shows strength.
For hundreds of ETF choices, be sure to reference Thursday’s StatSheet.
For this current domestic “Buy” cycle, here’s how some our candidates have fared:
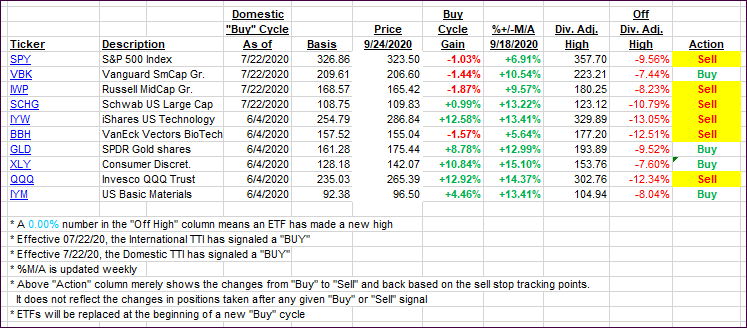
Click image to enlarge
Again, the %+/-M/A column above shows the position of the various ETFs in relation to their respective long-term trend lines, while the trailing sell stops are being tracked in the “Off High” column. The “Action” column will signal a “Sell” once the -8% point has been taken out in the “Off High” column. For more volatile sector ETFs, the trigger point is -10%.
3. Trend Tracking Indexes (TTIs)
Our TTIs diverged with the International one dropping sharply, while the Domestic one inched up a tad.
This is how we closed 09/24/2020:
Domestic TTI: +1.75% above its M/A (prior close +1.58%)—Buy signal effective 07/22/2020
International TTI: +0.52% above its M/A (prior close +1.03%)—Buy signal effective 07/22/2020
Disclosure: I am obliged to inform you that I, as well as my advisory clients, own some of the ETFs listed in the above table. Furthermore, they do not represent a specific investment recommendation for you, they merely show which ETFs from the universe I track are falling within the specified guidelines.
Contact Ulli