
- Moving the markets
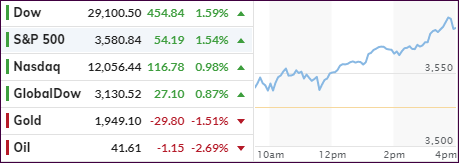
Yesterday’s positive 1st trading day in the historically volatile month of September continued full force with the major indexes surging, as the S&P 500 and Nasdaq set new records in the process.
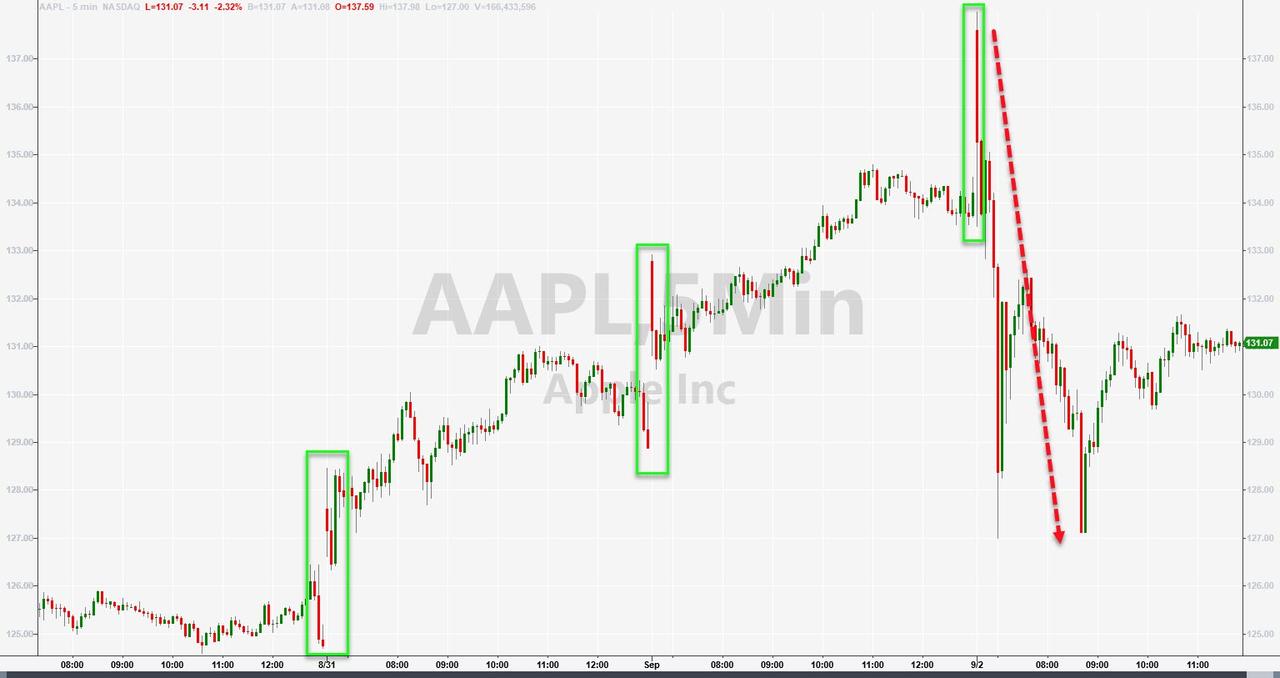
Traders took some profits out of highflyers like Apple and Tesla and rotated into more beaten-down shares in other parts of the markets. For a change, the Dow and S&P 500 lead the major indexes, while the Nasdaq lagged for this session.
Anything is possible, as MS equity strategist Mike Wilson explained:
“I remain very constructive over the next 12 months,” Wilson said. “I think we’re a little bit overcooked … It’s impossible to try to time these types of corrections,” Wilson said. “It would not surprise me if we got a 10% correction, but it wouldn’t be surprising if we didn’t, either. We’re in a bull market.”
Today’s ramp was based on, well, no supporting news. Sure, US factory orders surprised to the upside, but remain down YoY.
And:
- Congressional leaders in Washington appear to be as far apart as ever on agreeing to another relief package.
- A much-touted plasma treatment does not appear to be effective against Covid-19, based on current research.
- ADP said private payrolls grew by 428k in August vs. expectations of a gain of 1.17 million
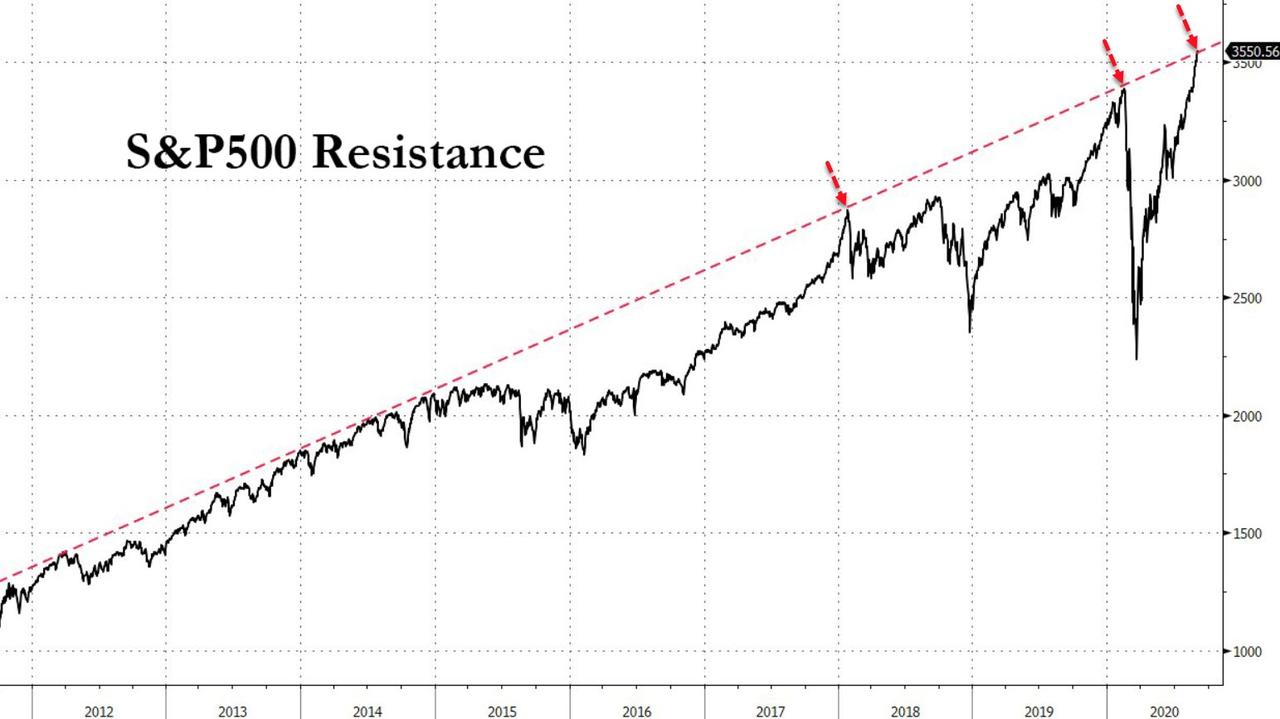
The above was nothing market moving, but from a technical point of view, the S&P 500 has now reached a critical resistance level, according to ZH. Whether history repeats itself, is anyone’s guess.
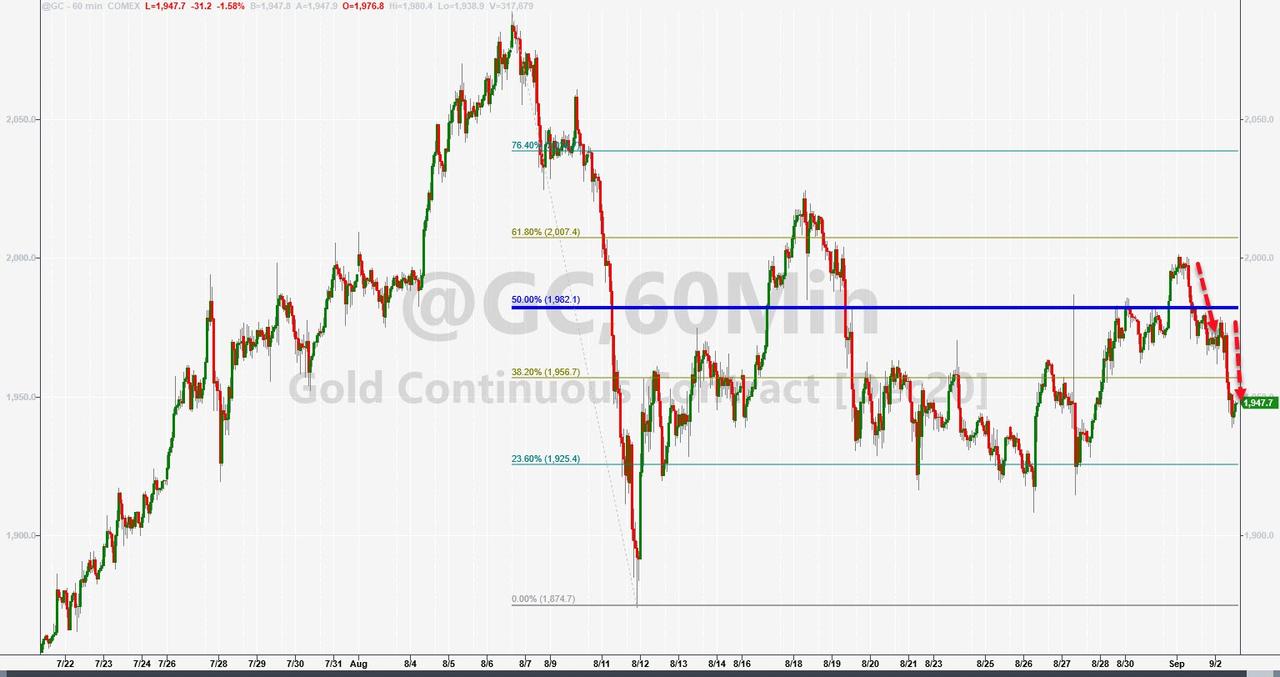
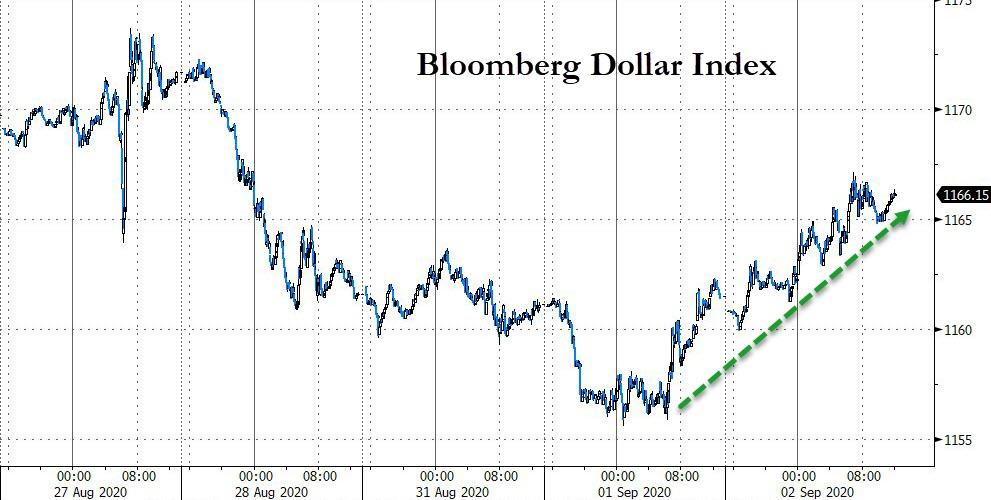
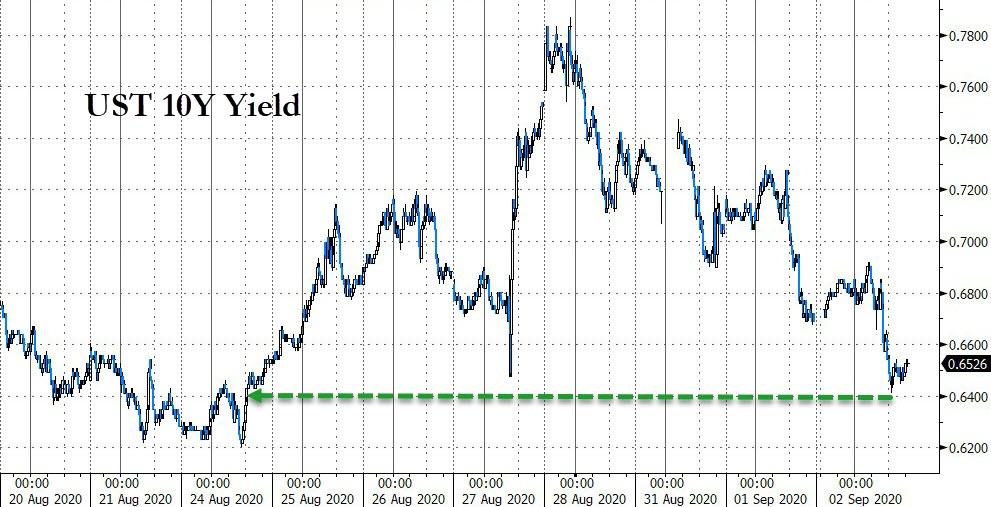
Gold dropped again, as the US dollar rebounded sharply and took the starch out of the precious metal, while bond yields dropped to a level last seen in late August.
It was another wild and crazy day in the markets with odd things happening in the VIX arena, while this rally was supported with nothing but hot air.
2. ETFs in the Spotlight
In case you missed the announcement and description of this section, you can read it here again.
It features some of the 10 broadly diversified domestic and sector ETFs from my HighVolume list as posted every Saturday. Furthermore, they are screened for the lowest MaxDD% number meaning they have been showing better resistance to temporary sell offs than all others over the past year.
The below table simply demonstrates the magnitude with which these ETFs are fluctuating above or below their respective individual trend lines (%+/-M/A). A break below, represented by a negative number, shows weakness, while a break above, represented by a positive percentage, shows strength.
For hundreds of ETF choices, be sure to reference Thursday’s StatSheet.
For this current domestic “Buy” cycle, here’s how some our candidates have fared:
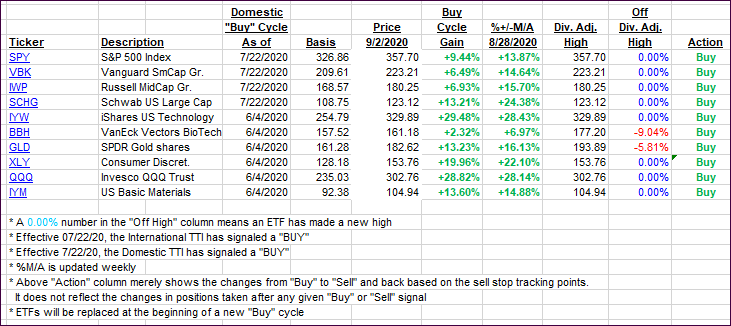
Click image to enlarge
Again, the %+/-M/A column above shows the position of the various ETFs in relation to their respective long-term trend lines, while the trailing sell stops are being tracked in the “Off High” column. The “Action” column will signal a “Sell” once the -8% point has been taken out in the “Off High” column. For more volatile sector ETFs, the trigger point is -10%.
3. Trend Tracking Indexes (TTIs)
Our TTIs surged as the markets catapulted higher for now fundamental reason.
This is how we closed 09/02/2020:
Domestic TTI: +10.31% above its M/A (prior close +8.38%)—Buy signal effective 07/22/2020
International TTI: +7.82% above its M/A (prior close +6.77%)—Buy signal effective 07/22/2020
Disclosure: I am obliged to inform you that I, as well as my advisory clients, own some of the ETFs listed in the above table. Furthermore, they do not represent a specific investment recommendation for you, they merely show which ETFs from the universe I track are falling within the specified guidelines.
Contact Ulli