

- Moving the markets
After yesterday’s modest pullback (Dow and S&P), all of the major indexes came screaming back with the Nasdaq and S&P 500 ending up in record high territory, while the Dow did not set any records but sported a solid gain of +0.76%.
To no surprise, the Nasdaq took top billing with a studly performance of +1.39%, which was bested by our Telecom holding IYW, which catapulted an amazing +2.14%. GLD rode the roller coaster, but a late spike assured a green close of +0.11%.
Equities shifted into overdrive late in the session, after a report showed that American manufacturing stormed ahead for the 4th straight month, with the ISM index rising to 56 in August from 54.2 in July.
Commented an economist interviewed by MarketWatch:
“Some of the manufacturing data that came out really helped boost investor confidence today. You have to acknowledge that a lot of this economic data is coming off extremely low and distressed numbers,” she said. “But what’s most important to the market is that we’re moving in the right direction.”
Another historic event happened today when AAPL finally caught up with the Russell 2000 meaning it surpassed its entire market cap, as this chart shows. In other words, the market is defined by the direction of Apple.
Even though we don’t see it yet, we have to accept that we may be stuck in biggest stock market bubble in history, however, it is unknown how much further it can or will expand before it finally bursts.
Therefore, I continue to sound like a broken record: “You must have an exit strategy to protect your portfolio should this market euphoria come to an end.”
2. ETFs in the Spotlight
In case you missed the announcement and description of this section, you can read it here again.
It features some of the 10 broadly diversified domestic and sector ETFs from my HighVolume list as posted every Saturday. Furthermore, they are screened for the lowest MaxDD% number meaning they have been showing better resistance to temporary sell offs than all others over the past year.
The below table simply demonstrates the magnitude with which these ETFs are fluctuating above or below their respective individual trend lines (%+/-M/A). A break below, represented by a negative number, shows weakness, while a break above, represented by a positive percentage, shows strength.
For hundreds of ETF choices, be sure to reference Thursday’s StatSheet.
For this current domestic “Buy” cycle, here’s how some our candidates have fared:
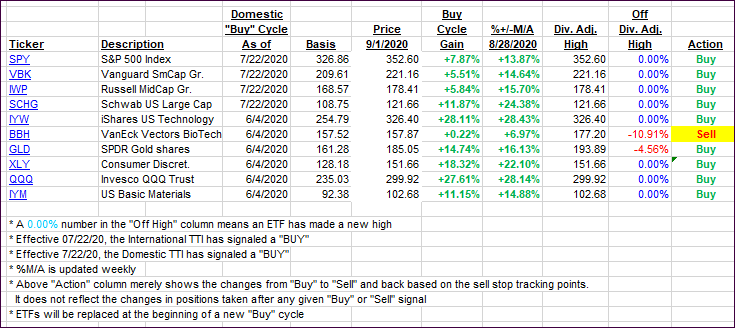
Click image to enlarge
Again, the %+/-M/A column above shows the position of the various ETFs in relation to their respective long-term trend lines, while the trailing sell stops are being tracked in the “Off High” column. The “Action” column will signal a “Sell” once the -8% point has been taken out in the “Off High” column. For more volatile sector ETFs, the trigger point is -10%.
3. Trend Tracking Indexes (TTIs)
Our TTIs climbed deeper into bullish territory, as today’s advance was more broad-based.
This is how we closed 09/01/2020:
Domestic TTI: +8.38% above its M/A (prior close +7.83%)—Buy signal effective 07/22/2020
International TTI: +6.77% above its M/A (prior close +6.58%)—Buy signal effective 07/22/2020
Disclosure: I am obliged to inform you that I, as well as my advisory clients, own some of the ETFs listed in the above table. Furthermore, they do not represent a specific investment recommendation for you, they merely show which ETFs from the universe I track are falling within the specified guidelines.
Contact Ulli