
- Moving the markets
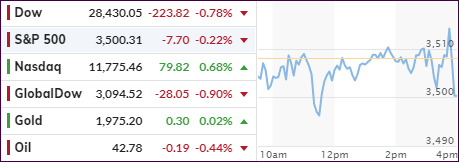
The Dow and the S&P 500 started the session in the red, bounced around their unchanged lines but could not muster enough upward momentum to achieve a green close. The Nasdaq, on the other hand, never slipped into the read and closed +0.68%, which was off its intra-day high.
The Dow slumped all day, as traders tried to figure out how its so-called divisor, used to mitigate the impact of stock splits (Apple) as well as the removal and addition of companies to its composition, would affect this price-weighted index.
Because the value of the Dow is determined by calculating the sum of the prices of its components using a divisor that also factors when a company splits its shares, S&P Dow Jones Indices felt compelled to adjust the makeup of the benchmark. Stock splits can swing the balance of influence for any one blue-chip component.
MarketWatch
Much of today’s optimism came from the same source, namely potential coronavirus cures, along with hopes for fast-tracking vaccines, and making them available before the end of final stage trials.
Some of this confidence was offset by the reality that additional fiscal stimulus is necessary, yet the warring parties are not even close to an agreement on the amount of next-round stimulus spending.
Last week’s Fed change in using average inflation targeting implies that the Central Bank may remain in low interest rate mode for a longer period, a fact that will assist equities but could cause issues should inflation run hotter than anticipated.
For sure, uncertainty rules, which makes this a good environment for owning precious metals, but patience is required to deal with sudden short-term setbacks.
2. ETFs in the Spotlight
In case you missed the announcement and description of this section, you can read it here again.
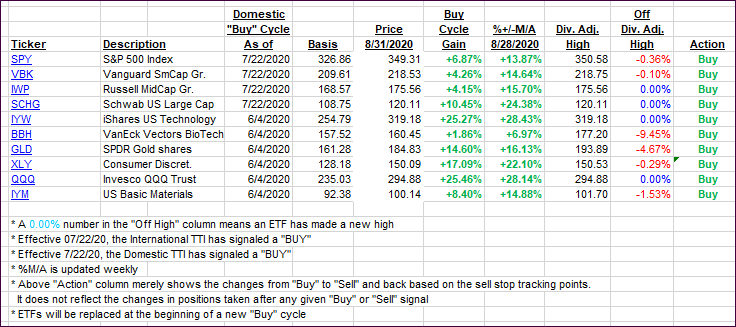
It features some of the 10 broadly diversified domestic and sector ETFs from my HighVolume list as posted every Saturday. Furthermore, they are screened for the lowest MaxDD% number meaning they have been showing better resistance to temporary sell offs than all others over the past year.
The below table simply demonstrates the magnitude with which these ETFs are fluctuating above or below their respective individual trend lines (%+/-M/A). A break below, represented by a negative number, shows weakness, while a break above, represented by a positive percentage, shows strength.
For hundreds of ETF choices, be sure to reference Thursday’s StatSheet.
For this current domestic “Buy” cycle, here’s how some our candidates have fared:
Click image to enlarge
Again, the %+/-M/A column above shows the position of the various ETFs in relation to their respective long-term trend lines, while the trailing sell stops are being tracked in the “Off High” column. The “Action” column will signal a “Sell” once the -8% point has been taken out in the “Off High” column. For more volatile sector ETFs, the trigger point is -10%.
3. Trend Tracking Indexes (TTIs)
Our TTIs came Friday’s highs due to today’s bounce being narrowly focused on the tech sector.
This is how we closed 08/31/2020:
Domestic TTI: +7.83% above its M/A (prior close +8.74%)—Buy signal effective 07/22/2020
International TTI: +6.58% above its M/A (prior close +7.22%)—Buy signal effective 07/22/2020
Disclosure: I am obliged to inform you that I, as well as my advisory clients, own some of the ETFs listed in the above table. Furthermore, they do not represent a specific investment recommendation for you, they merely show which ETFs from the universe I track are falling within the specified guidelines.
Contact Ulli