
- Moving the markets
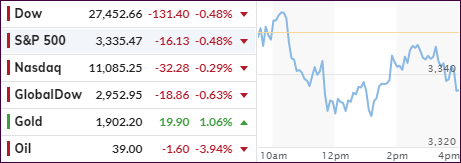
Today was opposite day. After yesterday’s strong rally fed by enthusiasm over a fresh stimulus deal and new coronavirus vaccines, today’s early bounce hit the skids, as all these fuzzy feelings gave way to the reality that nothing may be accomplished, while pandemic deaths are on the rise in NY.
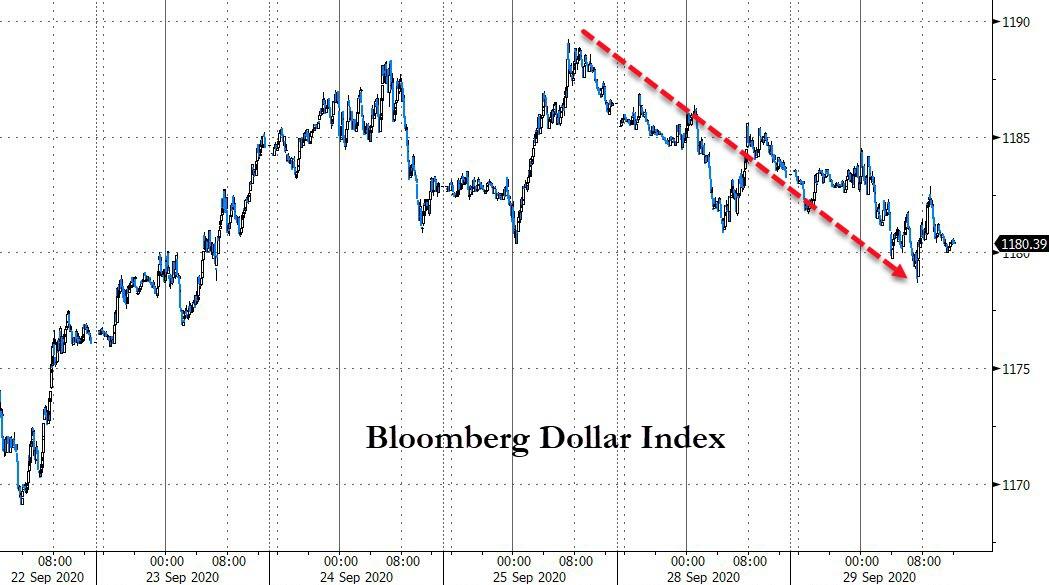
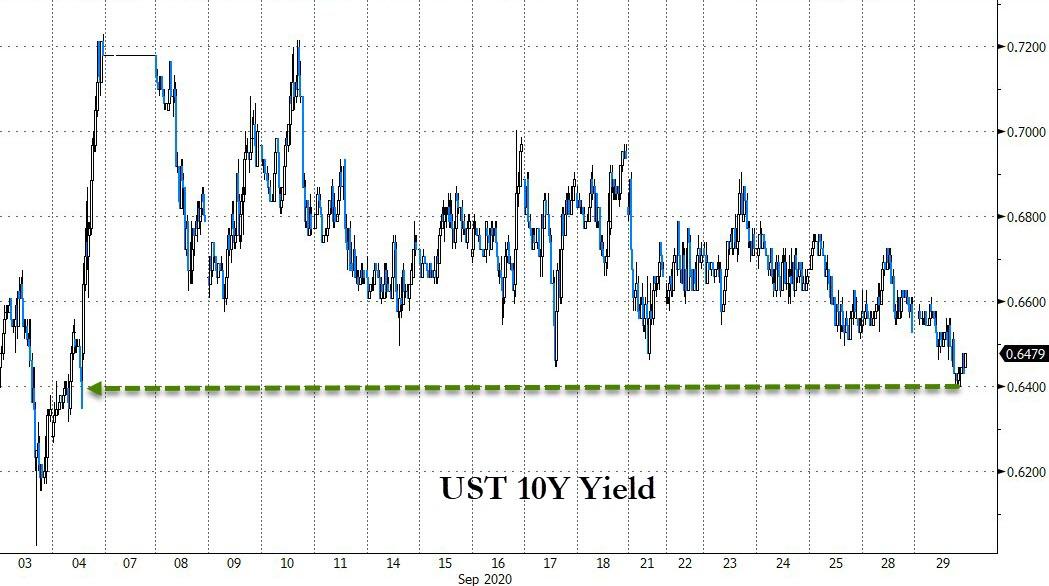
In the end, equities fell modestly and snapped a 3-day winning streak, but Gold bucked the trend, regained its $1,900 level, and closed solidly in the green supported by a sliding US Dollar and dropping bond yields.
Anxiety and uncertainty prevail giving tonight’s upcoming debate. Added CNBC:
Traders also looked ahead to the first debate between President Donald Trump and Democratic nominee Joe Biden set for Tuesday night. Some Wall Street analysts believe the first debate of this cycle could be more consequential for the markets than most debates, with a clear victory by one candidate possibly creating significant volatility.
“Everyone knows what they’re going to get with Trump, for better or worse,” said Peter Boockvar, chief investment officer at Bleakley Advisory Group. “The question then is what will Biden deliver. If Biden doesn’t kick any balls in his own net, then the market will take that as a win for him.”
For sure, we will see a market reaction tomorrow no matter what the outcome, however, the magnitude of it is the big unknown.
2. ETFs in the Spotlight
In case you missed the announcement and description of this section, you can read it here again.
It features some of the 10 broadly diversified domestic and sector ETFs from my HighVolume list as posted every Saturday. Furthermore, they are screened for the lowest MaxDD% number meaning they have been showing better resistance to temporary sell offs than all others over the past year.
The below table simply demonstrates the magnitude with which these ETFs are fluctuating above or below their respective individual trend lines (%+/-M/A). A break below, represented by a negative number, shows weakness, while a break above, represented by a positive percentage, shows strength.
For hundreds of ETF choices, be sure to reference Thursday’s StatSheet.
For this current domestic “Buy” cycle, here’s how some our candidates have fared:
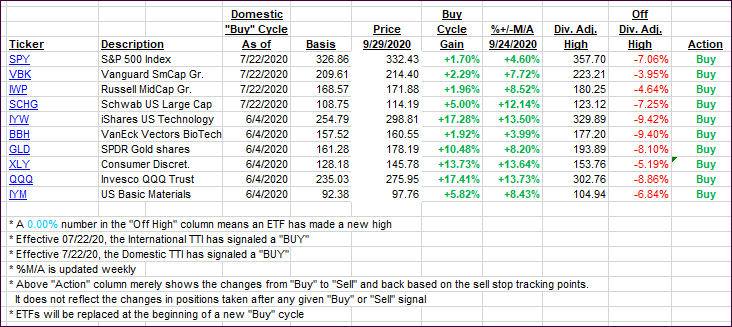
Click image to enlarge
Again, the %+/-M/A column above shows the position of the various ETFs in relation to their respective long-term trend lines, while the trailing sell stops are being tracked in the “Off High” column. The “Action” column will signal a “Sell” once the -8% point has been taken out in the “Off High” column. For more volatile sector ETFs, the trigger point is -10%.
3. Trend Tracking Indexes (TTIs)
Our TTIs went south, as they came off yesterday’s highs.
This is how we closed 09/29/2020:
Domestic TTI: +4.98% above its M/A (prior close +5.79%)—Buy signal effective 07/22/2020
International TTI: +2.46% above its M/A (prior close +3.19%)—Buy signal effective 07/22/2020
Disclosure: I am obliged to inform you that I, as well as my advisory clients, own some of the ETFs listed in the above table. Furthermore, they do not represent a specific investment recommendation for you, they merely show which ETFs from the universe I track are falling within the specified guidelines.
Contact Ulli