
- Moving the markets
After the somewhat chaotic US presidential debate, the future markets headed lower by as much as 1%, with Asian trading being sloppy and choppy, while Europe also headed south.
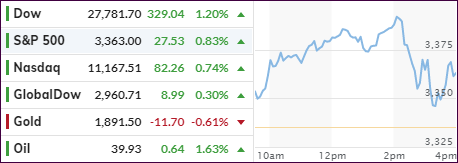
None of that mattered, as renewed hopes for further coronavirus stimulus pushed the major indexes to higher levels throughout the session in addition to some encouraging economic data. Pending Home Sales soared 8.8% MoM, which was far better than the 3.1% rise expected. This sent the YoY rise in pending home sales to +20.5%, the biggest annual gain since April 2010, according to ZH. Of course, that comes as no surprise given the “tremendously low interest rates.”
ADP Employment also came in better than expectations with a 749,000 increase in jobs in September, which boosted hopes that Friday’s payroll number could come in at close to 800,000.
Today’s surge to higher levels hit a glass ceiling mid-session, when the Mnuchin-Pelosi meeting turned into a dud. Senate majority leader McConnell poured cold water on the rally by declaring that the Senate and House are “very, very far apart” on stimulus talks. He made it clear that they will not come up to the $2.2 trillion number the Democrats were demanding.
The rally hit the skids and south we went but last hour buying prevented the indexes from slipping into the red.
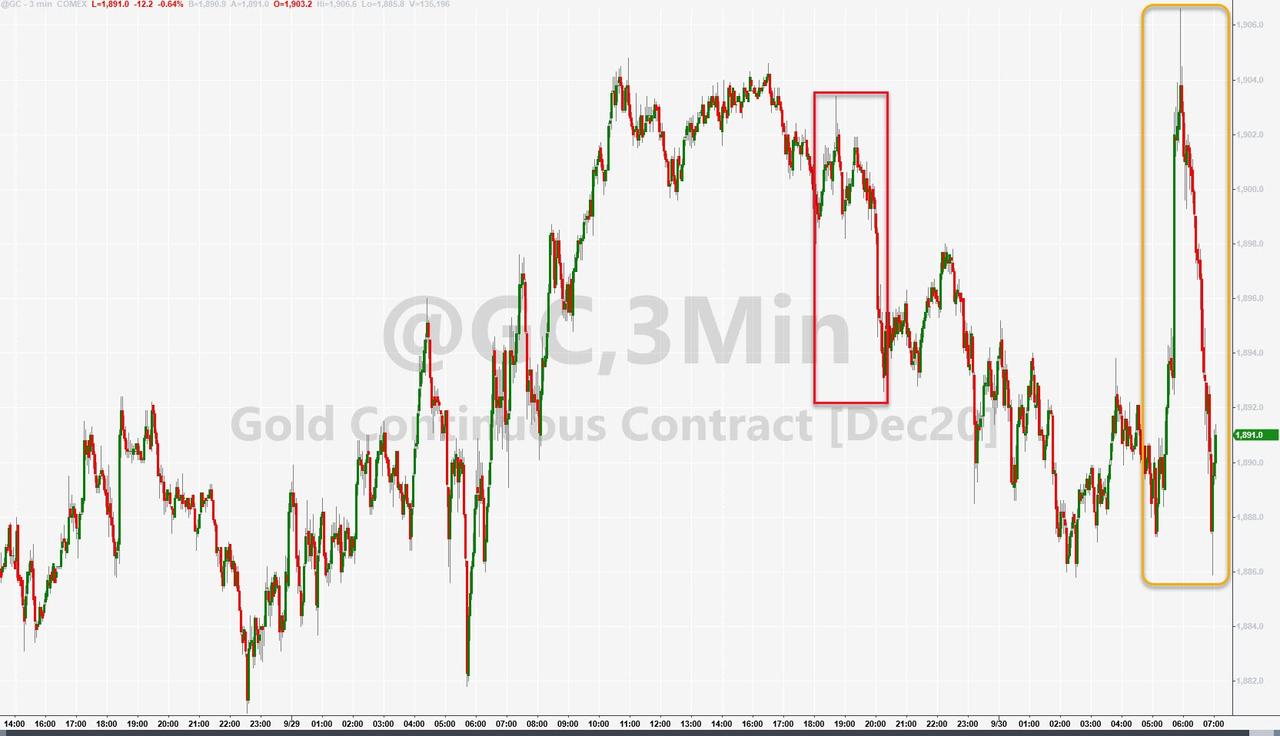
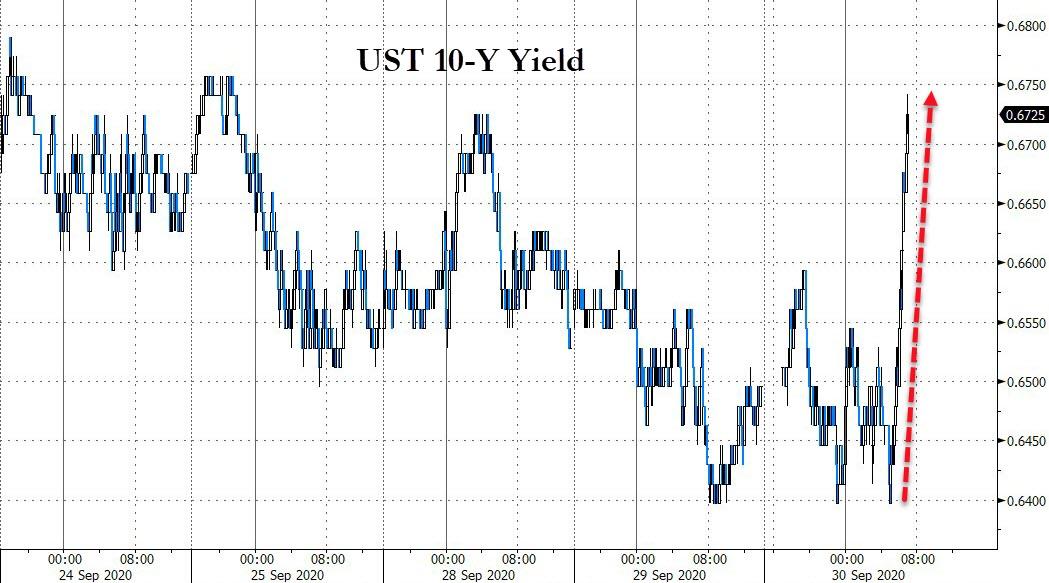
Gold rode the giant rollercoaster by getting pumped and dumped but ending up on the downside, as US 10-year bond yields surged. Could have been quarter-end rebalancing…
In the end, while the quarter was positive for the indexes, equities suffered their worst September since 2011. And now, we’ll be facing the notoriously volatile October—where anything can happen.
According to Bloomberg, on average, the S&P 500 has lost 2.5% in October over the past seven election years (since 1992), the worst performance of any month during that period.
2. ETFs in the Spotlight
In case you missed the announcement and description of this section, you can read it here again.
It features some of the 10 broadly diversified domestic and sector ETFs from my HighVolume list as posted every Saturday. Furthermore, they are screened for the lowest MaxDD% number meaning they have been showing better resistance to temporary sell offs than all others over the past year.
The below table simply demonstrates the magnitude with which these ETFs are fluctuating above or below their respective individual trend lines (%+/-M/A). A break below, represented by a negative number, shows weakness, while a break above, represented by a positive percentage, shows strength.
For hundreds of ETF choices, be sure to reference Thursday’s StatSheet.
For this current domestic “Buy” cycle, here’s how some our candidates have fared:
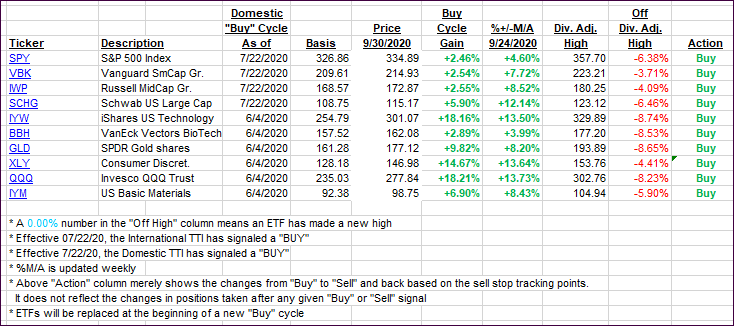
Click image to enlarge
Again, the %+/-M/A column above shows the position of the various ETFs in relation to their respective long-term trend lines, while the trailing sell stops are being tracked in the “Off High” column. The “Action” column will signal a “Sell” once the -8% point has been taken out in the “Off High” column. For more volatile sector ETFs, the trigger point is -10%.
3. Trend Tracking Indexes (TTIs)
Our TTIs recovered and closed slightly higher.
This is how we closed 09/31/2020:
Domestic TTI: +5.50% above its M/A (prior close +4.98%)—Buy signal effective 07/22/2020
International TTI: +2.74% above its M/A (prior close +2.46%)—Buy signal effective 07/22/2020
Disclosure: I am obliged to inform you that I, as well as my advisory clients, own some of the ETFs listed in the above table. Furthermore, they do not represent a specific investment recommendation for you, they merely show which ETFs from the universe I track are falling within the specified guidelines.
Contact Ulli