
- Moving the markets
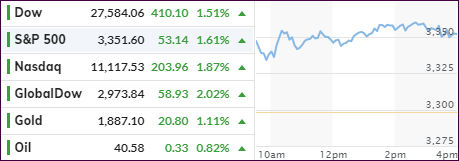
Last week’s sour market sentiment started to swing in the opposite direction on Friday with equity bulls sensing a turnaround, despite election uncertainty. Even though September has been a down month, it was not as bad as originally feared by traders, hence the sudden outlook that the bull may have more room to run.
The futures started things on a positive by tracking solid gains in European and Asian markets, as optimism reigned that the recent selloff was overdone. The dollar slipped and bond yields rose reversing the recent trend.
Also assisting the buoyant mood and providing a boost to equities were comments from Speaker Pelosi that a last-minute coronavirus aid deal may still be a possibility. That news alone put a bottom under the ramping markets, and we never looked back, as a steady climb pushed the major indexes solidly in the green.
I took the opportunity to add some equity exposure to our holdings, which I consider a fairly low-risk proposition due to our Trend Tracking Indexes (TTIs) having been stuck within striking distance of a potential “Sell” signal two trading sessions ago thereby lessening the downside risk.
Today’s advance was broad based and not just focused on tech, as the S&P 500 managed to keep up with the Nasdaq for most of the session, while global stocks outperformed the domestic main indexes for a change.
This surge could be the beginning of a new bullish phase, or simply be an outlier event. Since no one has any idea how this will play out, we will continue to track our trailing sell stops and execute them, should the need arise.
2. ETFs in the Spotlight
In case you missed the announcement and description of this section, you can read it here again.
It features some of the 10 broadly diversified domestic and sector ETFs from my HighVolume list as posted every Saturday. Furthermore, they are screened for the lowest MaxDD% number meaning they have been showing better resistance to temporary sell offs than all others over the past year.
The below table simply demonstrates the magnitude with which these ETFs are fluctuating above or below their respective individual trend lines (%+/-M/A). A break below, represented by a negative number, shows weakness, while a break above, represented by a positive percentage, shows strength.
For hundreds of ETF choices, be sure to reference Thursday’s StatSheet.
For this current domestic “Buy” cycle, here’s how some our candidates have fared:
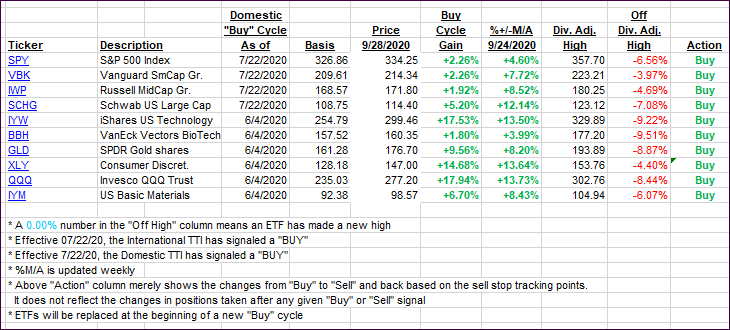
Click image to enlarge
Again, the %+/-M/A column above shows the position of the various ETFs in relation to their respective long-term trend lines, while the trailing sell stops are being tracked in the “Off High” column. The “Action” column will signal a “Sell” once the -8% point has been taken out in the “Off High” column. For more volatile sector ETFs, the trigger point is -10%.
3. Trend Tracking Indexes (TTIs)
Our TTIs jumped as markets continued with their recovery efforts.
This is how we closed 09/28/2020:
Domestic TTI: +5.79% above its M/A (prior close +3.83%)—Buy signal effective 07/22/2020
International TTI: +3.19% above its M/A (prior close +1.14%)—Buy signal effective 07/22/2020
Disclosure: I am obliged to inform you that I, as well as my advisory clients, own some of the ETFs listed in the above table. Furthermore, they do not represent a specific investment recommendation for you, they merely show which ETFs from the universe I track are falling within the specified guidelines.
Contact Ulli