
- Moving the markets
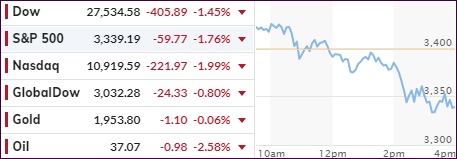
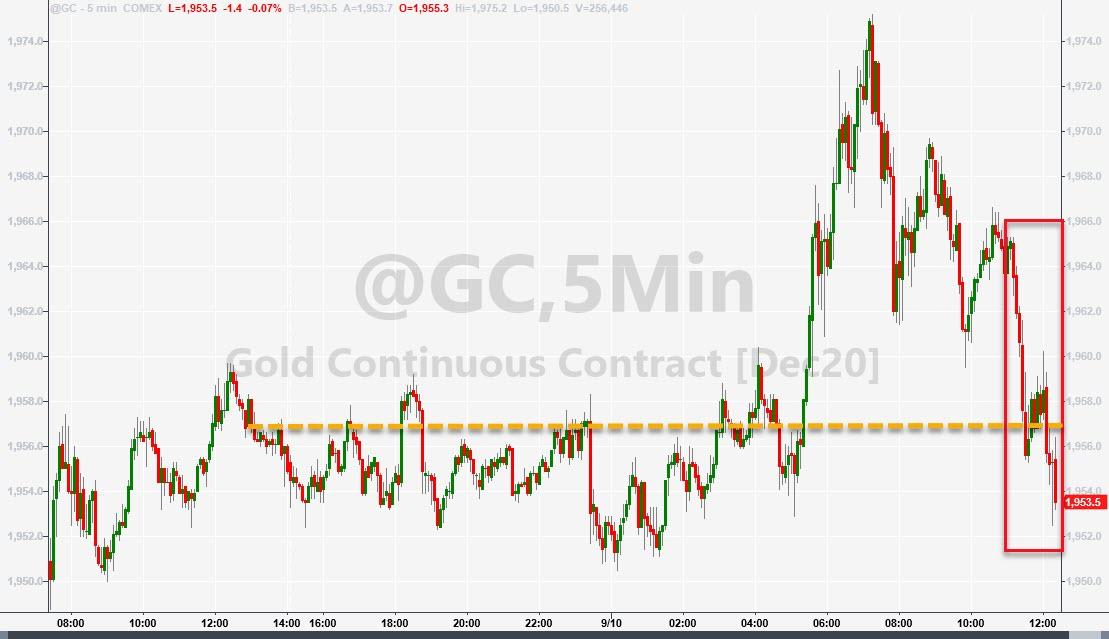
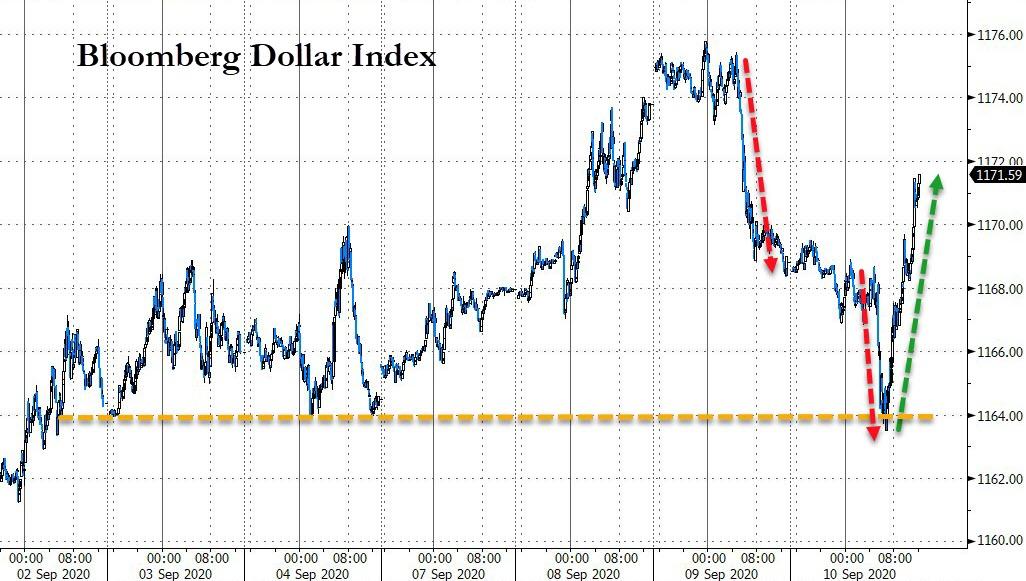
The first part of the session showed the bulls clearly in charge when suddenly Brexit concerns hit the headlines, which was followed by news that the Democrats voted to block the Republican’s stimulus bill. That was enough send stocks, bonds, and gold diving, while the dollar enjoyed a rebound rally.
ZH summed up the 3 things that kept the bullish dream alive in the last few weeks:
- The Fed – hasn’t bought any HY/IG bonds in a while and balance sheet flat
- Stimulus – fail on any further deal (McConnell Senate comments and skinny bailout bill didn’t pass Senate)
- Vaccine – the AstraZeneca news did not help
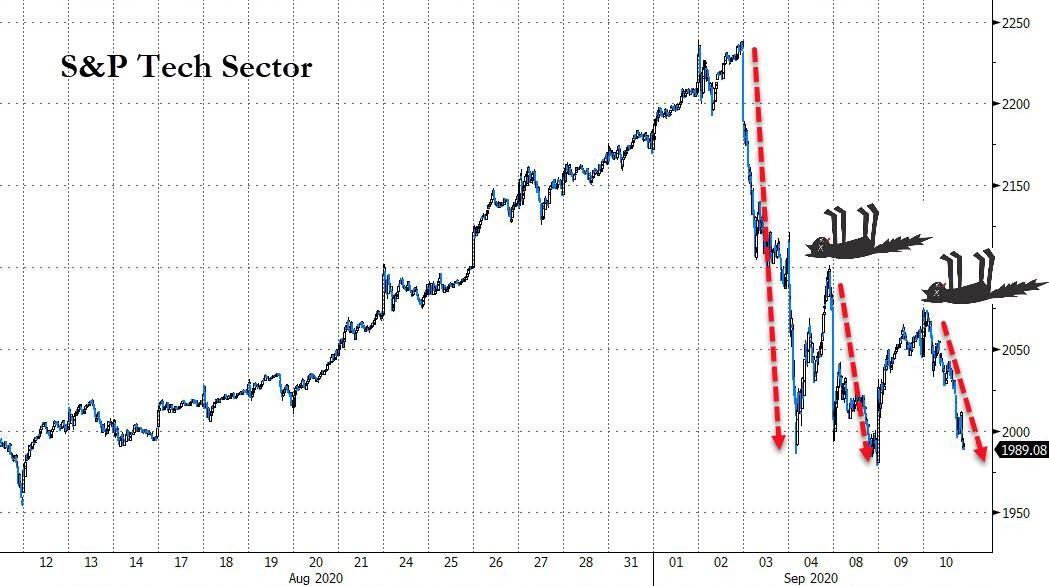
The Nasdaq swung wildly between +1.5% and -2% causing one of our tech ETFs, which had been bouncing against its trailing sell stop point, to break through it, giving me a reason to sell it and take profits. The index has now moved back into correction territory, and we’ll have to wait and see if this was just another flesh wound, when compared to the recent enthusiasm, or if there is more injury to come.
At this moment, yesterday’s rebound looks like a dead cat bounce, but we are living in such uncertain times where anything is possible, so it pays to be more cautious and take some money off the table.
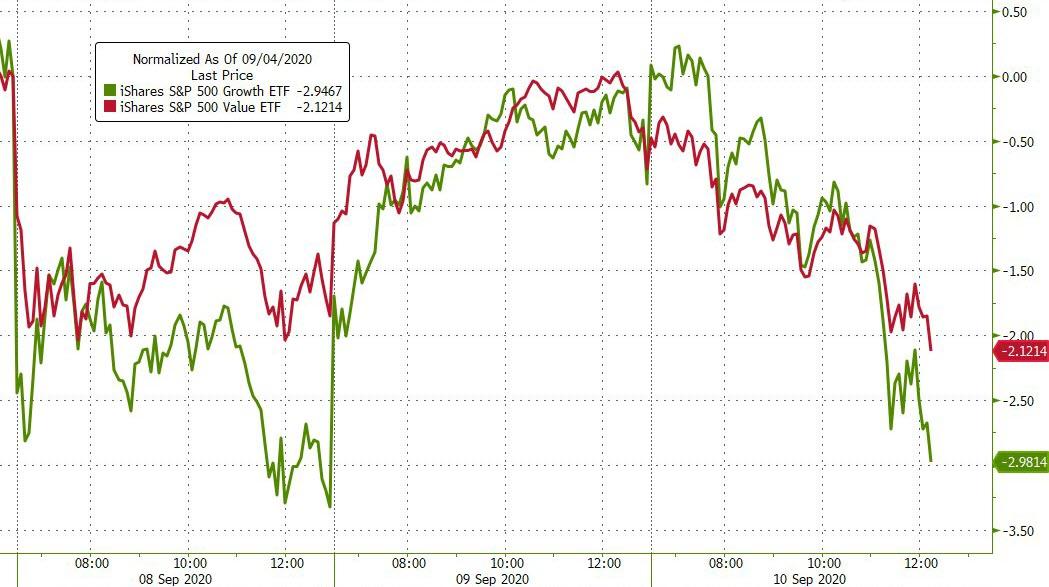
The much hoped for rotation from growth to value has not worked out so far, as both seem to be moving in sync.
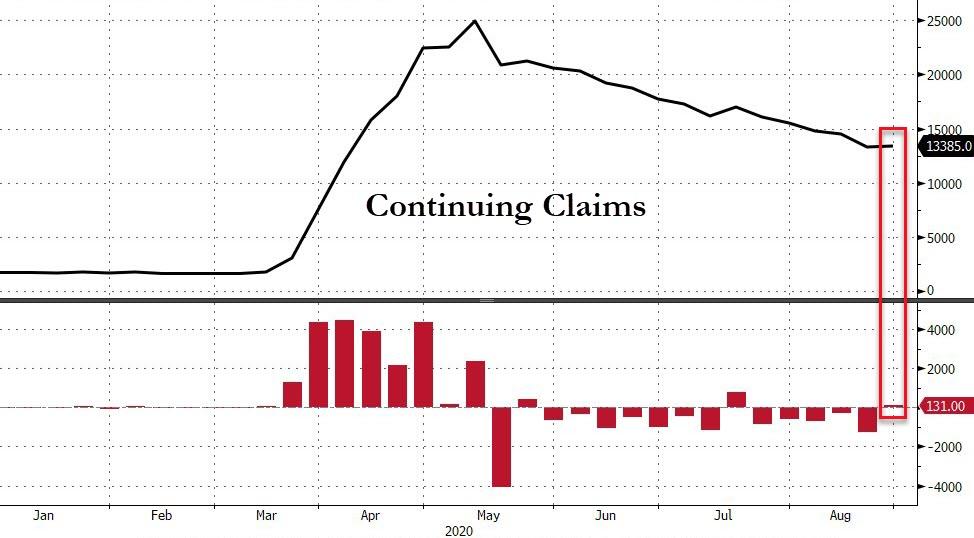
Not helping the mood were Jobless Claims with the Initial ones staying about even with last week, while the Continuing Claims rose week-over-week.
All this brings back the question as to whether the analog to 1929 is still valid. So far, it’s a remarkable development:

2. ETFs in the Spotlight
In case you missed the announcement and description of this section, you can read it here again.
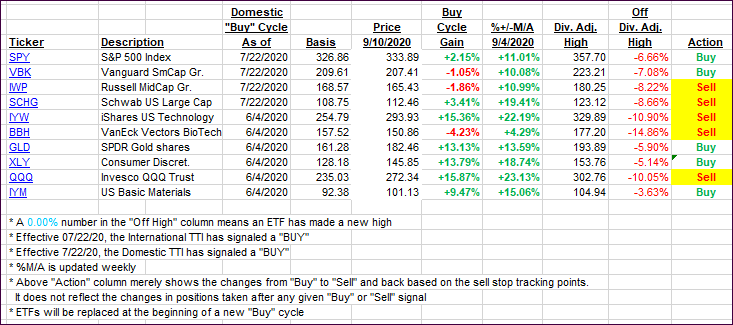
It features some of the 10 broadly diversified domestic and sector ETFs from my HighVolume list as posted every Saturday. Furthermore, they are screened for the lowest MaxDD% number meaning they have been showing better resistance to temporary sell offs than all others over the past year.
The below table simply demonstrates the magnitude with which these ETFs are fluctuating above or below their respective individual trend lines (%+/-M/A). A break below, represented by a negative number, shows weakness, while a break above, represented by a positive percentage, shows strength.
For hundreds of ETF choices, be sure to reference Thursday’s StatSheet.
For this current domestic “Buy” cycle, here’s how some our candidates have fared:
Click image to enlarge
Again, the %+/-M/A column above shows the position of the various ETFs in relation to their respective long-term trend lines, while the trailing sell stops are being tracked in the “Off High” column. The “Action” column will signal a “Sell” once the -8% point has been taken out in the “Off High” column. For more volatile sector ETFs, the trigger point is -10%.
3. Trend Tracking Indexes (TTIs)
Our TTIs reversed and dropped sharply, as the roller coaster ride of uncertainty continued.
This is how we closed 09/10/2020:
Domestic TTI: +4.98% above its M/A (prior close +6.50%)—Buy signal effective 07/22/2020
International TTI: +4.54% above its M/A (prior close +5.41%)—Buy signal effective 07/22/2020
Disclosure: I am obliged to inform you that I, as well as my advisory clients, own some of the ETFs listed in the above table. Furthermore, they do not represent a specific investment recommendation for you, they merely show which ETFs from the universe I track are falling within the specified guidelines.
Contact Ulli