
ETF Tracker StatSheet
You can view the latest version here.
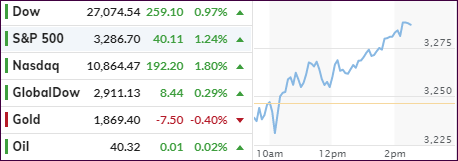
EQUITIES HEAD FOR 4TH STRAIGHT WEEKLY LOSS
- Moving the markets
Due to me traveling this afternoon, this is an early commentary with the markets still open for another 90 minutes or so. It looks like after some early uncertainty the bulls have taken charge, but I doubt it will be enough to make up the week’s losses.
I will make the necessary updates to the ETFs in the Spotlight and the Trend Tracking Indexes (TTIs) as soon as I get to my destination.
While the sell-off appears to have stabilized somewhat, all three major indexes are down for the week and look to mark their longest weekly slide since August 2019. I am not seeing real strength with the trend having shifted from bullish to first sideways and then to bearish. Stock fund outflows have reached nearly two-year highs.
This is clearly demonstrated when reviewing my above referenced StatSheet showing the 4-week momentum figures to be in the red across the board with some exceptions being zero coupon bond funds.
Mainstream Media pretty ignored one of the most critical announcements regarding an unprecedented monetary overhaul with the Fed planning to deposit “digital dollars” directly to “each American” during a recession.
Yes, you could call it Helicopter money, and it will have a tremendous impact on our financial lives. Please take the time to read this article. It’s a bit lengthy but well worth it.
I will be back with my regular posting schedule on Monday.
2. ETFs in the Spotlight
In case you missed the announcement and description of this section, you can read it here again.
It features some of the 10 broadly diversified domestic and sector ETFs from my HighVolume list as posted every Saturday. Furthermore, they are screened for the lowest MaxDD% number meaning they have been showing better resistance to temporary sell offs than all others over the past year.
The below table simply demonstrates the magnitude with which these ETFs are fluctuating above or below their respective individual trend lines (%+/-M/A). A break below, represented by a negative number, shows weakness, while a break above, represented by a positive percentage, shows strength.
For hundreds of ETF choices, be sure to reference Thursday’s StatSheet.
For this current domestic “Buy” cycle, here’s how some our candidates have fared:
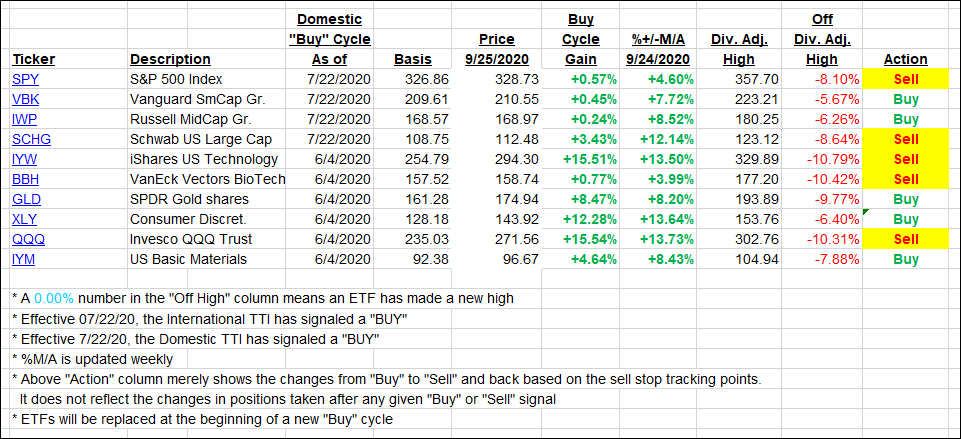
Again, the %+/-M/A column above shows the position of the various ETFs in relation to their respective long-term trend lines, while the trailing sell stops are being tracked in the “Off High” column. The “Action” column will signal a “Sell” once the -8% point has been taken out in the “Off High” column. For more volatile sector ETFs, the trigger point is -10%.
3. Trend Tracking Indexes (TTIs)
Our TTIs recovered with the major indexes being in rally mode—at least for the day.
This is how we closed 09/25/2020:
Domestic TTI: +3.83% above its M/A (prior close +1.75%)—Buy signal effective 07/22/2020
International TTI: +1.14% above its M/A (prior close +0.52%)—Buy signal effective 07/22/2020
Disclosure: I am obliged to inform you that I, as well as my advisory clients, own some of the ETFs listed in the above table. Furthermore, they do not represent a specific investment recommendation for you, they merely show which ETFs from the universe I track are falling within the specified guidelines.
———————————————————-
WOULD YOU LIKE TO HAVE YOUR INVESTMENTS PROFESSIONALLY MANAGED?
Do you have the time to follow our investment plans yourself? If you are a busy professional who would like to have his portfolio managed using our methodology, please contact me directly or get more details here.
———————————————————
Back issues of the ETF Tracker are available on the web.
Contact Ulli