
- Moving the markets
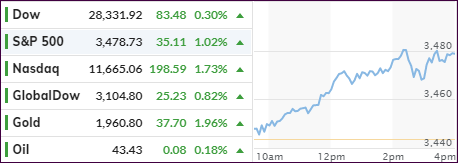
In a repeat from yesterday, the S&P 500 and Nasdaq surged to new highs with the latter sporting an impressive gain of +1.73% while the former trailed but logged in a solid +1.02%. The Dow fell short and lagged again, but gold put on an impressive performance as well.
News of progress of coronavirus vaccine trials supported the bullish mood, as did expectations that the Fed would keep easy monetary policy alive when Powell speaks on Thursday.
Added MarketWatch:
Fed Chair Powell will deliver a webcast address to the annual Jackson Hole gathering of central banks on Thursday which is taking place virtually this year. He’s expected to outline changes to the Fed’s policy framework that would allow inflation to run hotter than in the past, ending the Fed practice of hiking interest rates at the first whiff of rising price pressures.
This will be one of the ingredients necessary to keep the market in an ascending direction, at least for a while, until inflation gets out of hand, and then what? History has shown that inflation, once accelerating, can’t be simply controlledvvia an “off” switch. There will be consequences to that policy, but to me that will be the moment in time when precious metals truly shine.
Traders are also looking for additional Fed action via more stimulus while the White House and the Dems are deadlocked on a new coronavirus package.
For sure, we are enjoying the ride, but we are aware and prepared to act should it come to an end all of a sudden.
2. ETFs in the Spotlight
In case you missed the announcement and description of this section, you can read it here again.
It features some of the 10 broadly diversified domestic and sector ETFs from my HighVolume list as posted every Saturday. Furthermore, they are screened for the lowest MaxDD% number meaning they have been showing better resistance to temporary sell offs than all others over the past year.
The below table simply demonstrates the magnitude with which these ETFs are fluctuating above or below their respective individual trend lines (%+/-M/A). A break below, represented by a negative number, shows weakness, while a break above, represented by a positive percentage, shows strength.
For hundreds of ETF choices, be sure to reference Thursday’s StatSheet.
For this current domestic “Buy” cycle, here’s how some our candidates have fared:
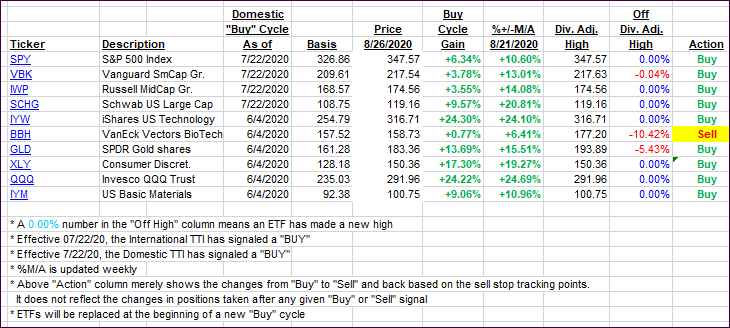
Click image to enlarge
Again, the %+/-M/A column above shows the position of the various ETFs in relation to their respective long-term trend lines, while the trailing sell stops are being tracked in the “Off High” column. The “Action” column will signal a “Sell” once the -8% point has been taken out in the “Off High” column. For more volatile sector ETFs, the trigger point is -10%.
3. Trend Tracking Indexes (TTIs)
Our TTIs were mixed again with the Domestic one slipping a tad, while the International rallied.
This is how we closed 08/26/2020:
Domestic TTI: +7.33% above its M/A (prior close +7.51%)—Buy signal effective 07/22/2020
International TTI: +6.90% above its M/A (prior close +6.10%)—Buy signal effective 07/22/2020
Disclosure: I am obliged to inform you that I, as well as my advisory clients, own some of the ETFs listed in the above table. Furthermore, they do not represent a specific investment recommendation for you, they merely show which ETFs from the universe I track are falling within the specified guidelines.
Contact Ulli