
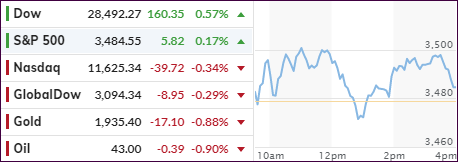
- Moving the markets
All eyes were on the Fed’s two-year review of their policy framework with the focus being on their new idea of AIT (Average Inflation Target), which allows for periods when inflation could run hotter to make up for periods when it falls below the target with an averaged being 2% annually.
Here are some of the more pertinent comments:
… in thinking about whether to raise the inflation target to a certain level, central banks need to take into account whether they are able to raise inflation to the new target level. If a new inflation target is too ambitious, and the central bank fails to attain it, the central bank may lose its credibility, which may render less effective any other policies it pursues. Also, the central bank may face the risk of getting trapped in a never-ending monetary accommodation even when real economic activity is strong or when financial stability risks accumulate.
Analyst Bill Blain simplified it like this:
‘Inflation Averaging’ means “don’t worry about rate-hikes, or any normalization of rates, we are so desperate for inflation we are going to encourage it and we want markets to love it… it’s a way of reassuring markets that there’s never going to be another interest rate rise!”
“hedge! …with gold… for the inevitability of this all going wrong!”
The markets reacted positively at first and then came off their highs with the Nasdaq and Gold closing in the red.
Uncertainty reigned and was not helped by the Initial Jobless Claims, which showed that another 1 million Americans filed for first-time benefits, as Bloomberg shows in this chart. This was offset by US Pending Home Sales surging to their highest since 2005, which is up a stunning 15.4% YoY, its biggest annual jump since October 2012.
In other words, we are seeing a mixed picture, which was not helped by more confusing comments, which ZH succinctly summed up like this:
*POWELL SAYS FED TO SEEK INFLATION THAT ‘AVERAGES’ 2% OVER TIME
…then ‘moderation’ sent them reeling:
*POWELL SAYS ANY INFLATION OVERSHOOTS WILL BE MODERATE
but he later reassured that they would let inflation run and things took off again…
*POWELL: SEEK TO RUN INFLATION ABOVE 2% AFTER PERIODS BELOW 2%
Then Pelosi triggered a drop in stocks (hitting right as Europe closed)…
1129ET *PELOSI SAYS NOT BUDGING ON STIMULUS, REPUBLICANS HAVE TO MOVE
This didn’t help!
1315ET *Kaplan: Markets Need to Understand How to Operate Without Fed Support
And then Pentagon headlines spooked markets a little late on…
1420ET *CHINA MILITARY SAYS U.S. WARSHIP EXPELLED NEAR PARACEL ISLANDS
And then Pelosi again…
1515ET *MEADOWS-PELOSI TALK DOESN’T APPEAR TO YIELD BREAK-THROUGHS
1530ET *PELOSI SAYS SHE IS STICKING TO HER DEMANDS ON STIMULUS
This should pretty much clear up any confusion as to what the next move in equities will be…
2. ETFs in the Spotlight
In case you missed the announcement and description of this section, you can read it here again.
It features some of the 10 broadly diversified domestic and sector ETFs from my HighVolume list as posted every Saturday. Furthermore, they are screened for the lowest MaxDD% number meaning they have been showing better resistance to temporary sell offs than all others over the past year.
The below table simply demonstrates the magnitude with which these ETFs are fluctuating above or below their respective individual trend lines (%+/-M/A). A break below, represented by a negative number, shows weakness, while a break above, represented by a positive percentage, shows strength.
For hundreds of ETF choices, be sure to reference Thursday’s StatSheet.
For this current domestic “Buy” cycle, here’s how some our candidates have fared:
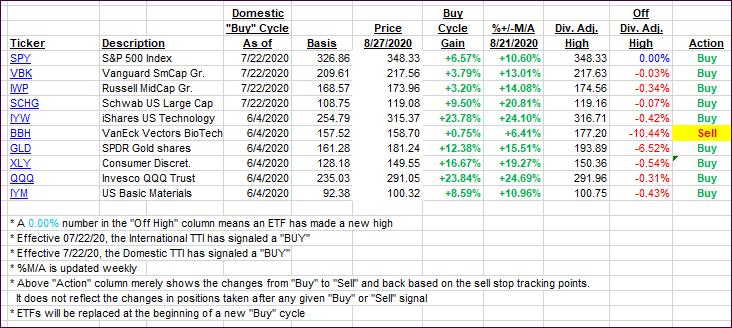
Click image to enlarge
Again, the %+/-M/A column above shows the position of the various ETFs in relation to their respective long-term trend lines, while the trailing sell stops are being tracked in the “Off High” column. The “Action” column will signal a “Sell” once the -8% point has been taken out in the “Off High” column. For more volatile sector ETFs, the trigger point is -10%.
3. Trend Tracking Indexes (TTIs)
Our TTIs reversed with the Domestic one gaining, while the International one corrected slightly.
This is how we closed 08/27/2020:
Domestic TTI: +7.88% above its M/A (prior close +7.33%)—Buy signal effective 07/22/2020
International TTI: +6.54% above its M/A (prior close +6.90%)—Buy signal effective 07/22/2020
Disclosure: I am obliged to inform you that I, as well as my advisory clients, own some of the ETFs listed in the above table. Furthermore, they do not represent a specific investment recommendation for you, they merely show which ETFs from the universe I track are falling within the specified guidelines.
Contact Ulli