
- Moving the markets
The markets opened slightly higher as positive vibes for equities were generated in part due to a phone call between top US and Chinese officials appearing to reaffirm their commitment to the phase one trade deal agreed to in early 2020. It’s not certain at all if this was simply pretense, because of the rise in tensions between the two parties.
China described the call as a “constructive” discussion between Vice Premier Liu He, the country’s top negotiator, and U.S. Trade Representative Robert Lighthizer and Treasury Secretary Steven Mnuchin. The U.S. said both sides “see progress and are committed to taking the steps necessary to ensure the success of the agreement.” The call came after plans for a discussion earlier this month were postponed.
Source: MarketWatch
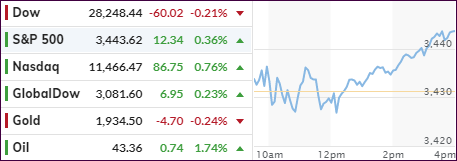
The major indexes continued to bounce around their respective unchanged lines with the Dow closing below it, while the S&P 500 and Nasdaq rallied with the latter taking not only top billing for the day with a gain of +0.76% but also notching another record high.
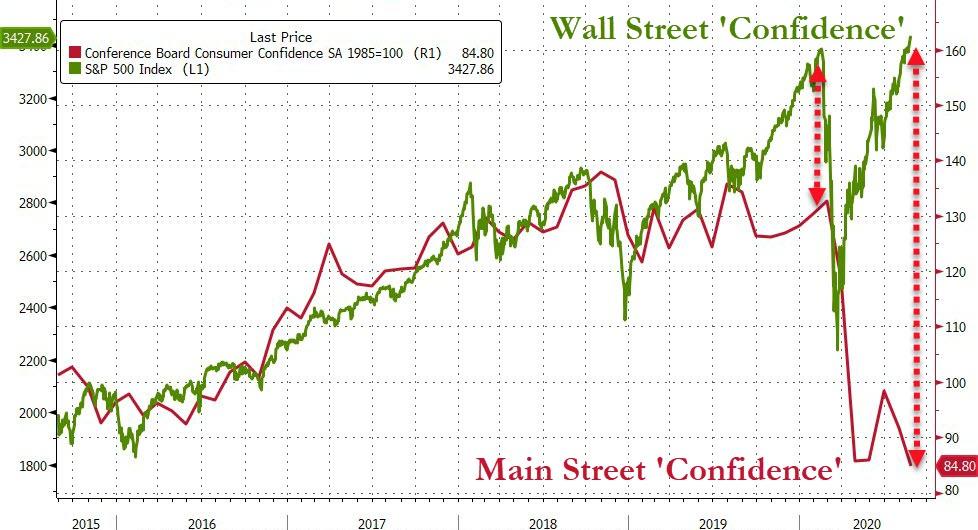
The mid-session uncertainty was stoked by a few economic reports, which suggested a mixed picture of underlying conditions, as ZH reported:
US Consumer Confidence re-plunges in August to 6-year lows
US New Home Sales surge in July, Highest annual spike since 1996
US Home Price growth slowed in June
Mortgage Delinquencies soar to Decade high
The weakness in gold continued, but GLD managed to eke out a small gain of +0.12%.
2. ETFs in the Spotlight
In case you missed the announcement and description of this section, you can read it here again.
It features some of the 10 broadly diversified domestic and sector ETFs from my HighVolume list as posted every Saturday. Furthermore, they are screened for the lowest MaxDD% number meaning they have been showing better resistance to temporary sell offs than all others over the past year.
The below table simply demonstrates the magnitude with which these ETFs are fluctuating above or below their respective individual trend lines (%+/-M/A). A break below, represented by a negative number, shows weakness, while a break above, represented by a positive percentage, shows strength.
For hundreds of ETF choices, be sure to reference Thursday’s StatSheet.
For this current domestic “Buy” cycle, here’s how some our candidates have fared:
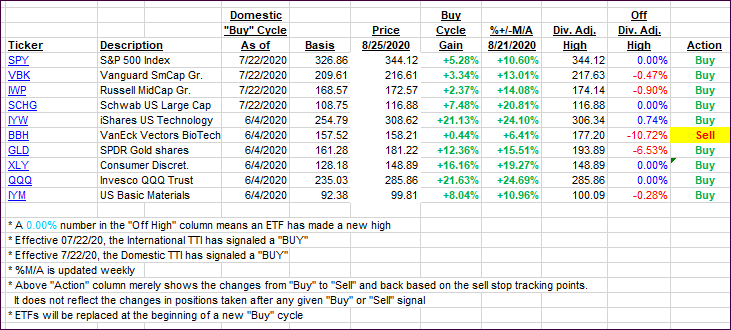
Click image to enlarge
Again, the %+/-M/A column above shows the position of the various ETFs in relation to their respective long-term trend lines, while the trailing sell stops are being tracked in the “Off High” column. The “Action” column will signal a “Sell” once the -8% point has been taken out in the “Off High” column. For more volatile sector ETFs, the trigger point is -10%.
3. Trend Tracking Indexes (TTIs)
Our TTIs were mixed with the Domestic one unchanged while the International one edged higher.
This is how we closed 08/25/2020:
Domestic TTI: +7.51% above its M/A (prior close +7.51%)—Buy signal effective 07/22/2020
International TTI: +6.10% above its M/A (prior close +5.80%)—Buy signal effective 07/22/2020
Disclosure: I am obliged to inform you that I, as well as my advisory clients, own some of the ETFs listed in the above table. Furthermore, they do not represent a specific investment recommendation for you, they merely show which ETFs from the universe I track are falling within the specified guidelines.
Contact Ulli