
- Moving the markets
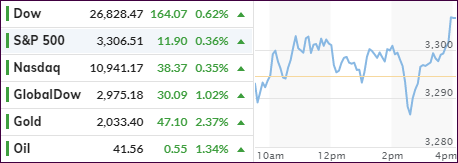
This morning, we saw another weak opening with the major indexes zigzagging and being pulled into the red before another magic last hour ramp pushed equities to a green close.
Mid-day, stocks obliterated some of their gains, as House Speaker Pelosi announced that she “doesn’t think there will be a deal this week,” referring to the endless back and forth about the size of the planned stimulus package.
She raised the ante to $3.4 trillion from $3 trillion, which is a far cry away from the Republican’s proposal of $1 trillion. This has the feeling as if someone wants to crash the markets.
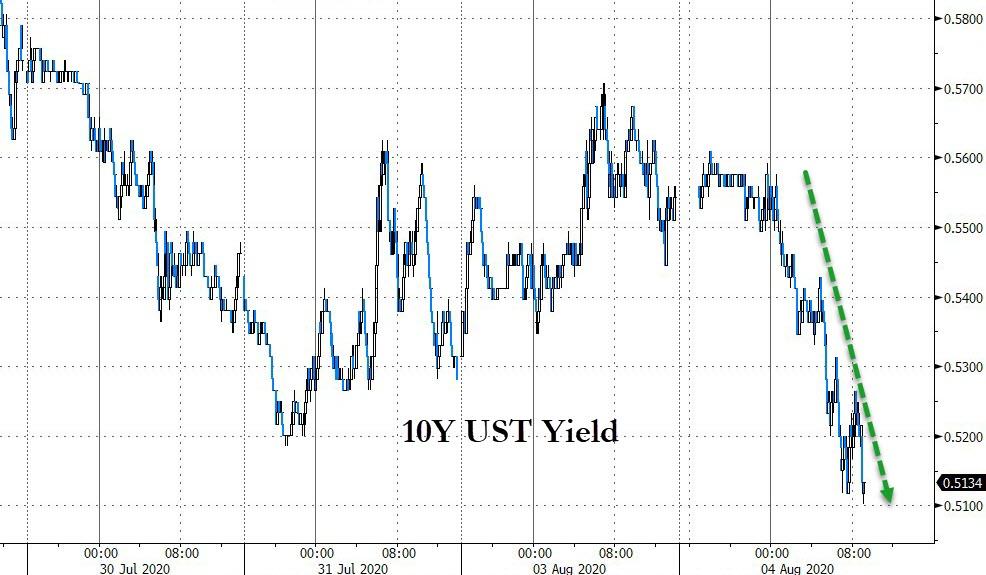
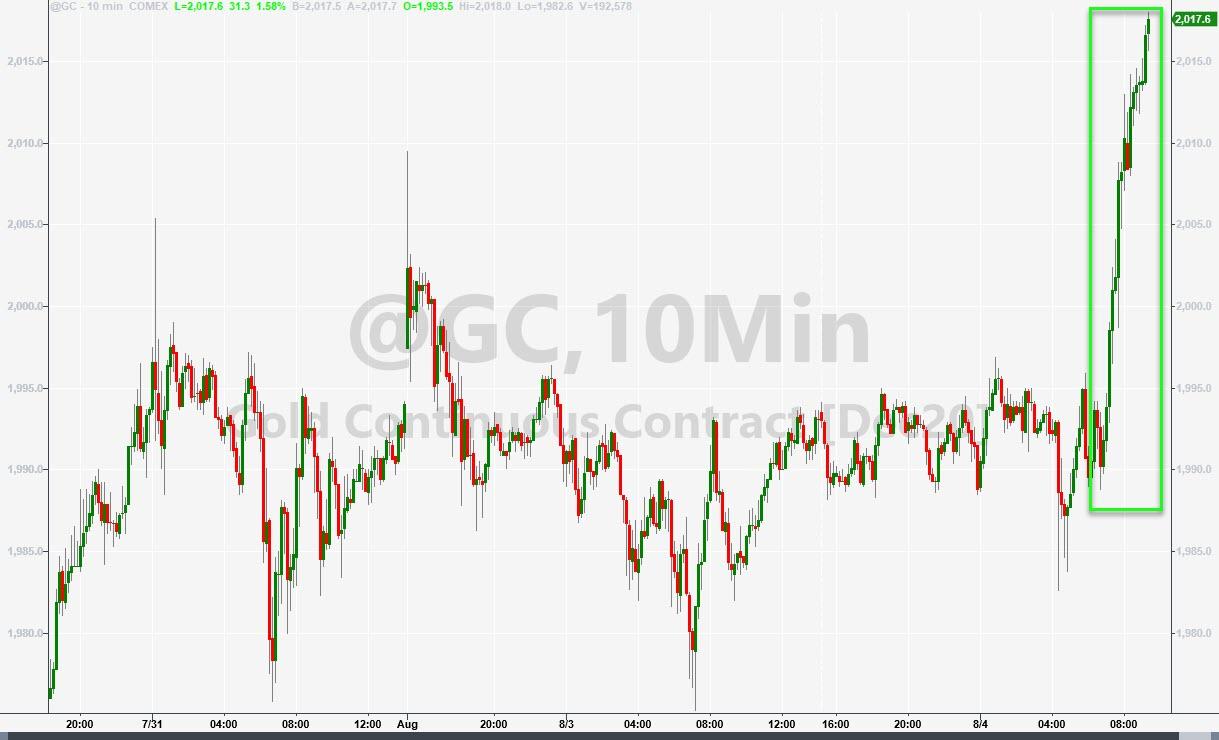
While that did not happen today, we saw a pullback in stocks, Treasury yields tumbling to a record closing low, while gold rocketed to new record highs, with the spot price braking the $2,000 level by a wide margin.
News headlines were confusing, as ZH pointed out:
1142ET Pelosi: “doesn’t think there will be a deal this week.”
1415ET *SEN. PERDUE SAYS SENATE STIMULUS TALKS MAY TAKE ANOTHER 2 WEEKS
1425ET *MCCONNEL: WILL NOT FIND TOTAL GOP CONSENSUS ON VIRUS RELIEF
1450ET *SCHUMER SAYS NOT GOING TO STRIKE A DEAL JUST FOR THE SAKE OF IT
1455ET *SCHUMER SAYS HE IS HOPEFUL, TALKS MOVING FORWARD BIT BY BIT
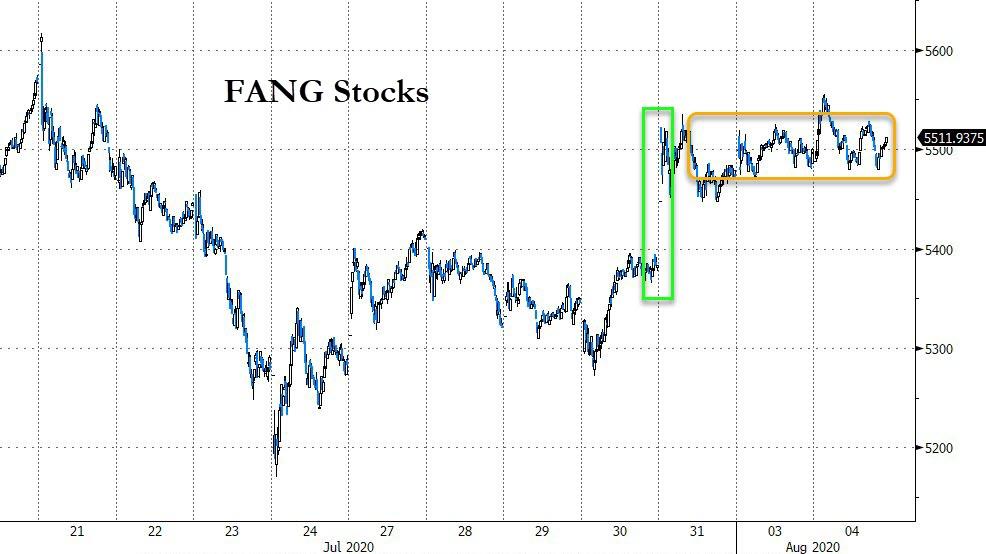
The Nasdaq was trailing the indexes today, which is to be expected after the sizzling run up, we have seen. The reason is in part that its big component, namely the FANG stocks, have been stuck in a trading range over the past three days, as Bloomberg demonstrates here.
Until a breakout occurs, big tech maybe treading water for a while.
2. ETFs in the Spotlight
In case you missed the announcement and description of this section, you can read it here again.
It features some of the 10 broadly diversified domestic and sector ETFs from my HighVolume list as posted every Saturday. Furthermore, they are screened for the lowest MaxDD% number meaning they have been showing better resistance to temporary sell offs than all others over the past year.
The below table simply demonstrates the magnitude with which these ETFs are fluctuating above or below their respective individual trend lines (%+/-M/A). A break below, represented by a negative number, shows weakness, while a break above, represented by a positive percentage, shows strength.
For hundreds of ETF choices, be sure to reference Thursday’s StatSheet.
For this current domestic “Buy” cycle, here’s how some our candidates have fared:

Click image to enlarge
Again, the %+/-M/A column above shows the position of the various ETFs in relation to their respective long-term trend lines, while the trailing sell stops are being tracked in the “Off High” column. The “Action” column will signal a “Sell” once the -8% point has been taken out in the “Off High” column. For more volatile sector ETFs, the trigger point is -10%.
3. Trend Tracking Indexes (TTIs)
Our TTIs edged higher again with the International one showing more momentum than the Domestic one.
This is how we closed 08/04/2020:
Domestic TTI: +4.19% above its M/A (prior close +3.68%)—Buy signal effective 07/22/2020
International TTI: +2.09% above its M/A (prior close +1.17%)—Buy signal effective 07/22/2020
Disclosure: I am obliged to inform you that I, as well as my advisory clients, own some of the ETFs listed in the above table. Furthermore, they do not represent a specific investment recommendation for you, they merely show which ETFs from the universe I track are falling within the specified guidelines.
Contact Ulli