
- Moving the markets
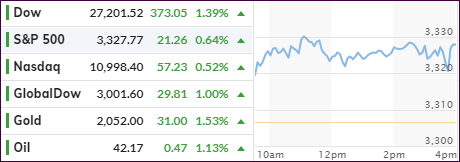
The Dow raced ahead and ended just short of a 400-point gain, but gold again outperformed with another solid +1.53% showing. The S&P closed within 1.7% of its all-time high.
The mood was upbeat, not because of facts, but merely hope of further stimulus from the government to assist the out-of-work Americans. However, concerns surfaced that Friday’s widely anticipated payroll report may show that the rise in Covid-19 infections could have stalled the recent revival of business activity.
Added MarketWatch:
Payroll provider Automatic Data Processing Inc. ADP, also said only 167,000 private-sector jobs were created in July, far short of the 1.88 million forecast by economists polled by Econoday. However, a reading of services from the Institute for Supply Management service sector index jumped to a reading of 58.1 in July, beating expectations and signaling stronger economic growth.
While tech trailed the other 2 indexes today, the Nasdaq nevertheless has now closed higher in six straight sessions and has been outperforming the Dow and S&P 500 YTD, but it is still lagging gold, which again roared into record territory.
This word of caution came from ZH:
A body in motion will remain in motion.
And while tech bulls will pounds the table and vow that the current tech bubble is far less dangerous than the dot com bubble of 2000, the reality is that that fwd multiples are now exponential and it is only a matter of time before this particular law of Newton encounters a sufficient painful “external force” that will burst the current tech bubble too.
In the meantime, as you would expect from gold’s surge, the negatively affected asset class is the US Dollar, which, thanks to the reckless money printers at the Fed, continues its path of least resistance—down.
2. ETFs in the Spotlight
In case you missed the announcement and description of this section, you can read it here again.
It features some of the 10 broadly diversified domestic and sector ETFs from my HighVolume list as posted every Saturday. Furthermore, they are screened for the lowest MaxDD% number meaning they have been showing better resistance to temporary sell offs than all others over the past year.
The below table simply demonstrates the magnitude with which these ETFs are fluctuating above or below their respective individual trend lines (%+/-M/A). A break below, represented by a negative number, shows weakness, while a break above, represented by a positive percentage, shows strength.
For hundreds of ETF choices, be sure to reference Thursday’s StatSheet.
For this current domestic “Buy” cycle, here’s how some our candidates have fared:

Click image to enlarge
Again, the %+/-M/A column above shows the position of the various ETFs in relation to their respective long-term trend lines, while the trailing sell stops are being tracked in the “Off High” column. The “Action” column will signal a “Sell” once the -8% point has been taken out in the “Off High” column. For more volatile sector ETFs, the trigger point is -10%.
3. Trend Tracking Indexes (TTIs)
Our TTIs jumped deeper into bullish territory, as the bulls continued to rule.
This is how we closed 08/05/2020:
Domestic TTI: +5.03% above its M/A (prior close +4.19%)—Buy signal effective 07/22/2020
International TTI: +3.01% above its M/A (prior close +2.09%)—Buy signal effective 07/22/2020
Disclosure: I am obliged to inform you that I, as well as my advisory clients, own some of the ETFs listed in the above table. Furthermore, they do not represent a specific investment recommendation for you, they merely show which ETFs from the universe I track are falling within the specified guidelines.
Contact Ulli