
ETF Tracker StatSheet
You can view the latest version here.
A DOWN WEEK ENDS IN THE GREEN
- Moving the markets
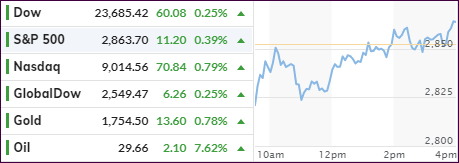
Another rollercoaster day, which had equities tumbling into the red after the opening bell but, as if by magic, an afternoon ramp pushed major indexes back to a green close. Nevertheless, we saw their worst weekly drop in two months.
However, the bounce-back was not nearly enough to make up for losses sustained early in the week. As a result, the S&P 500 surrendered -2.25% with added volatility due to option expiration making its mark during today’s back-and-forth action.
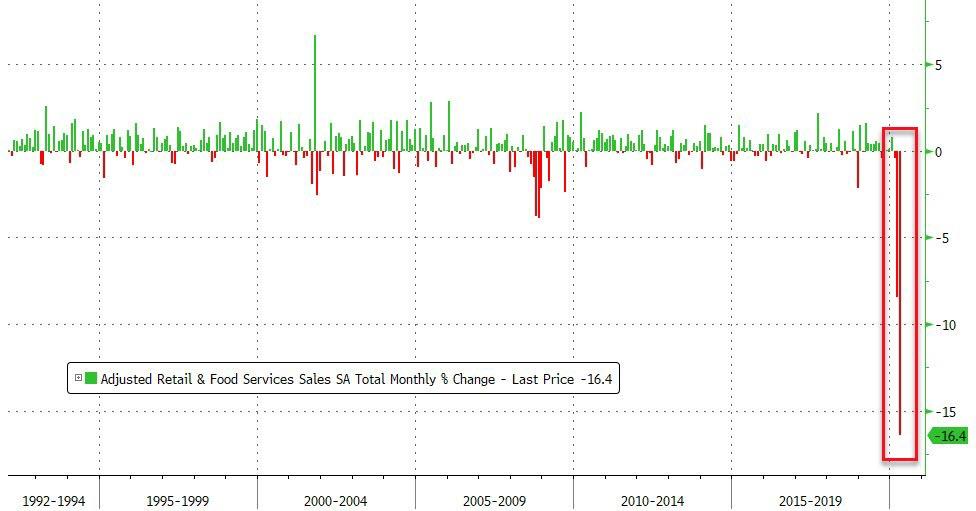
Horrific economic data points continue to pile up. Here are some of today’s headlines:
- US Retail Sales Crash By Most Ever In April, Cars & Clothing Clobbered
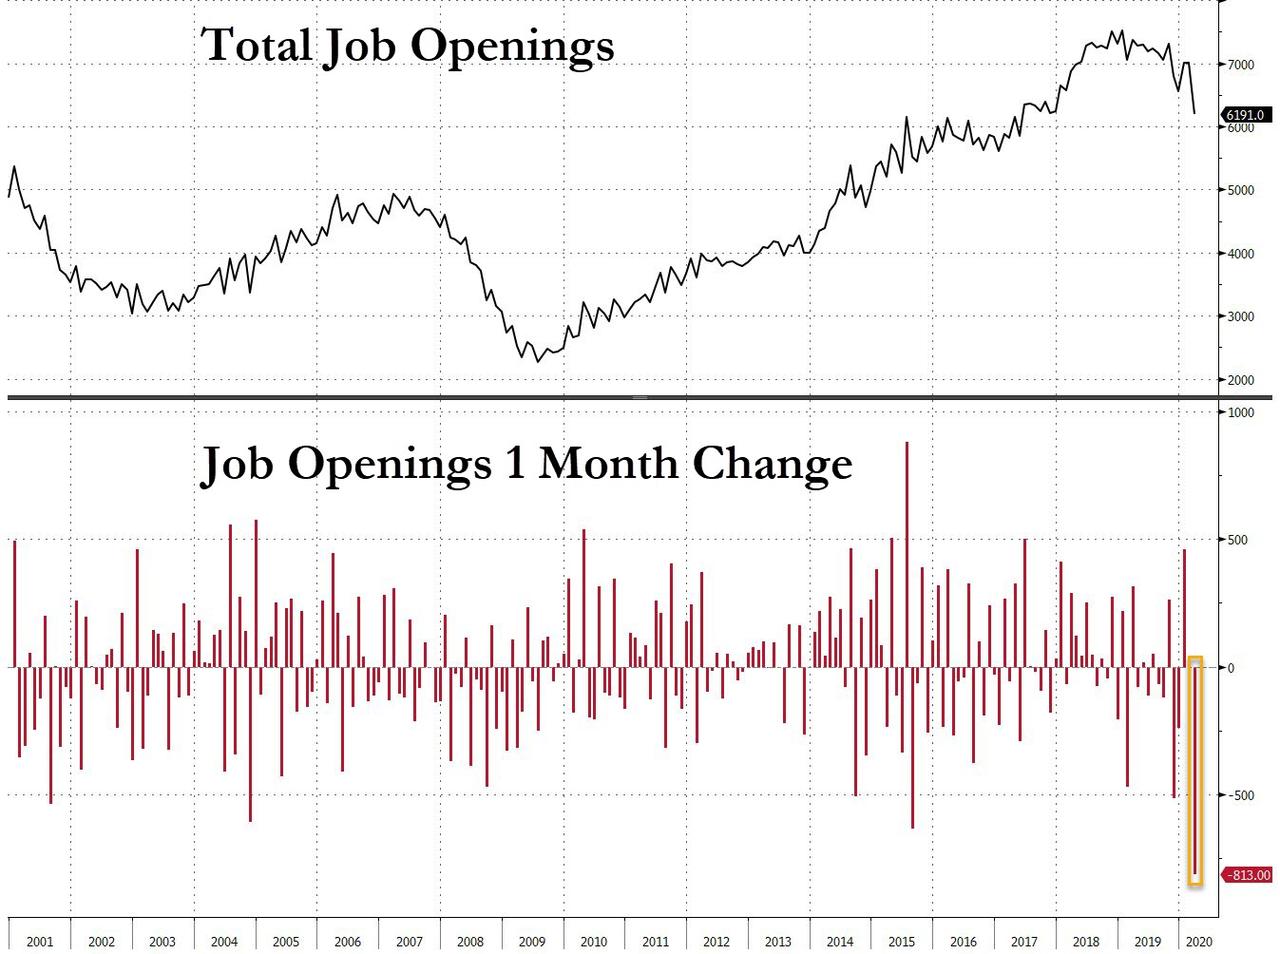
- Job Openings Plunge Most On Record Amid Mass Layoffs, Plunge In Hiring
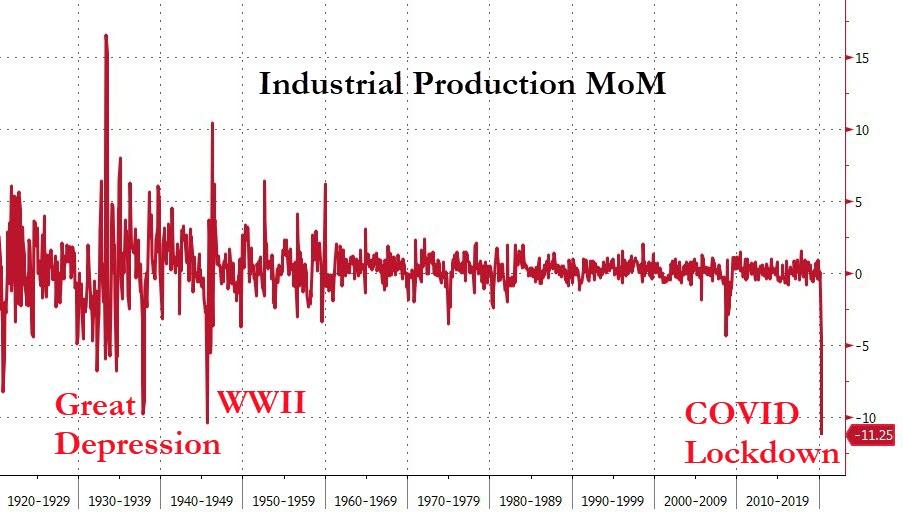
- US Industrial Production Plunges By Most In Over 100 Years
If you thought that this would have had a negative effect on market direction, you’d be wrong. It seems that the high-speed headline scanning computer algos are programmed to deal with negative news items like this in a simple way: Just ignore them.
In the end, the focus remains on the slow reopening of the country with the hope that the gradual lifting of restrictions will give an assist to a potential bottoming of the economy. The question in my mind is: Will it happen fast enough before further damage is done?
If not, even the computer algos will eventually have to realize that the bottom made in March could be in danger of being taken out.
2. ETFs in the Spotlight
In case you missed the announcement and description of this section, you can read it here again.
It features some of the 10 broadly diversified domestic and sector ETFs from my HighVolume list as posted every Saturday. Furthermore, they are screened for the lowest MaxDD% number meaning they have been showing better resistance to temporary sell offs than all others over the past year.
The below table simply demonstrates the magnitude with which these ETFs are fluctuating above or below their respective individual trend lines (%+/-M/A). A break below, represented by a negative number, shows weakness, while a break above, represented by a positive percentage, shows strength.
For hundreds of ETF choices, be sure to reference Thursday’s StatSheet.
For this past domestic “Buy” cycle, which ended on 2/27/2020, here’s how some our candidates have fared:
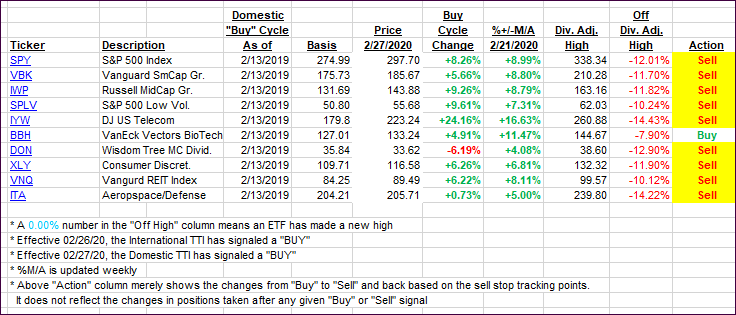
Again, the %+/-M/A column above shows the position of the various ETFs in relation to their respective long-term trend lines, while the trailing sell stops are being tracked in the “Off High” column. The “Action” column will signal a “Sell” once the -8% point has been taken out in the “Off High” column. For more volatile sector ETFs, the trigger point is -10%.
3. Trend Tracking Indexes (TTIs)
Our TTIs barely changed as the markets predominantly were treading water.
This is how we closed 05/15/2020:
- Domestic TTI: -12.60% below its M/A (prior close -13.00%)—Sell signal effective 02/27/2020
- International TTI: -13.96% below its M/A (prior close -14.00%)—Sell signal effective 02/26/2020
Disclosure: I am obliged to inform you that I, as well as my advisory clients, own some of the ETFs listed in the above table. Furthermore, they do not represent a specific investment recommendation for you, they merely show which ETFs from the universe I track are falling within the specified guidelines.
———————————————————-
WOULD YOU LIKE TO HAVE YOUR INVESTMENTS PROFESSIONALLY MANAGED?
Do you have the time to follow our investment plans yourself? If you are a busy professional who would like to have his portfolio managed using our methodology, please contact me directly or get more details here.
———————————————————
Back issues of the ETF Tracker are available on the web.
Contact Ulli