
- Moving the markets
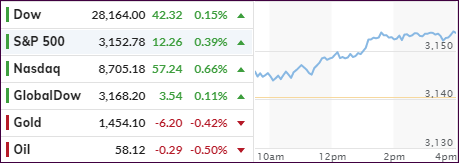
The markets continued to edge higher with the Dow and Nasdaq lagging early on but picking up steam mid-session to join the S&P 500 in green territory. Along the path, more records highs were set with positive economic data providing the necessary ammunition for the gains, which accelerated into the close.
There was little new information about the ongoing US-China trade war, so econ data had to carry the weight for this drive higher. We learned that Q3 GDP was unexpectedly revised up from 1.9% to 2.1% thanks in part to the Fed’s rate cutting efforts. At the same time, inflation remained subdued.
Home sales provide a mixed picture with new home sales being upwardly revised while pending home sales were showing a disappointing -1.78% MoM drop in October.
It’s I important to realize that over the past few weeks, since the dip in early October, markets have gone vertical with not even a 0.5% pullback in the S&P in 35 days. Obviously, the power to blast off like this came in the form of revving up the Fed’s printing presses (called ‘Not QE’) and Trump’s relentless tweets and comments of an imminent trade deal, which at this point does not look like it’s on the horizon. When reviewing the big picture, there are plenty of concerns that could have easily pulled down markets by 2-3%. But that did not happen—yet.
Which is why some analysts calling this extreme bullish optimism a “blow-off top.” This is especially concerning when considering that fundamentals are in total disconnect with stock market levels. Ed Yardeni’s indicator makes it all too obvious as to what could happen next.
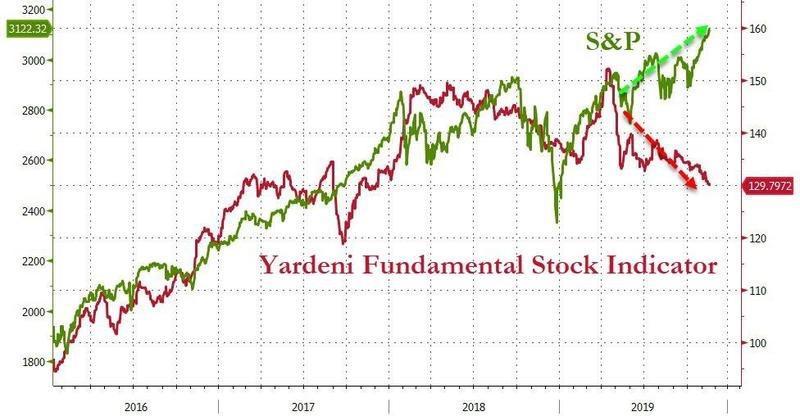
The markets will be closed on Thanksgiving and are only open for short session on Friday. I won’t write a weekending report but will post the StatSheet later today.
I will resume regular posting on Monday. In the meantime, I wish you a relaxing and enjoyable Thanksgiving weekend.
2. ETFs in the Spotlight
In case you missed the announcement and description of this section, you can t again.
It features 10 broadly diversified and sector ETFs from my HighVolume list as posted every Saturday. Furthermore, they are screened for the lowest MaxDD% number meaning they have been showing better resistance to temporary sell offs than all others over the past year.
The below table simply demonstrates the magnitude with which some of the ETFs are fluctuating regarding their positions above or below their respective individual trend lines (%+/-M/A). A break below, represented by a negative number, shows weakness, while a break above, represented by a positive percentage, shows strength.
For hundreds of ETF choices, be sure to reference Thursday’s StatSheet.
For this current domestic “Buy” cycle, here’s how some our candidates have fared:
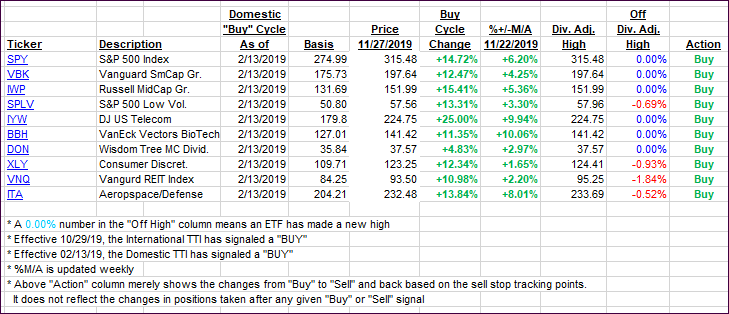
Again, the %+/-M/A column above shows the position of the various ETFs in relation to their respective long-term trend lines, while the trailing sell stops are being tracked in the “Off High” column. The “Action” column will signal a “Sell” once the -8% point has been taken out in the “Off High” column. For more volatile sector ETFs, the trigger point is -10%.
3. Trend Tracking Indexes (TTIs)
Our Trend Tracking Indexes (TTIs) headed north, as bullish sentiment appeared unstoppable.
Here’s how we closed 11/27/2019:
Domestic TTI: +6.87% above its M/A (prior close +6.41%)—Buy signal effective 02/13/2019
International TTI: +4.39% above its M/A (prior close +4.23%)—Buy signal effective 10/29/2019
Disclosure: I am obliged to inform you that I, as well as my advisory clients, own some of the ETFs listed in the above table. Furthermore, they do not represent a specific investment recommendation for you, they merely show which ETFs from the universe I track are falling within the specified guidelines.
Contact Ulli