
- Moving the markets
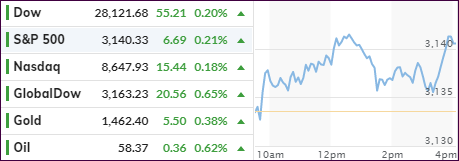
The major indexes managed to bounce back from early weakness and hovered safely above their respective unchanged lines bouncing in and out of record territory.
The fact that trade news said absolutely nothing new but mainly regurgitated the same old stuff as “we reached consensus on properly resolving relevant issues,” while the parties agreed to “stay in contact on the remaining points for a phase 1 trade deal.”
In other words, it’s amazing to me that the computer algos are still responding to the “artificial trade deal optimism,” which by now gets almost tiring to report on. One analyst wondered if this was just “a charade to keep stocks high, Trump happy, and China free to intervene in HK without angering the US president?”
Peak Prosperity’s Adam Taggert put it this way:
- Fool us once, shame on you.
- Fool us twice, shame on us.
- Fool us daily for a year… what the hell is wrong with us???
Then Fed head Powell threw in some positives during remarks last night outlining an optimistic view of the US economy. He also signaled that low inflation would keep interest rates low and that home prices have been spurred by that policy.
In the end, for us trend trackers, the reason for the ramping of the markets is secondary, because we will stay on board for as long as we can. Once our directional indictors, or the trailing sell stops, give the signal to step aside, we will head for the safety of the sidelines.
2. ETFs in the Spotlight
In case you missed the announcement and description of this section, you can read it here again.
It features 10 broadly diversified and sector ETFs from my HighVolume list as posted every Saturday. Furthermore, they are screened for the lowest MaxDD% number meaning they have been showing better resistance to temporary sell offs than all others over the past year.
The below table simply demonstrates the magnitude with which some of the ETFs are fluctuating regarding their positions above or below their respective individual trend lines (%+/-M/A). A break below, represented by a negative number, shows weakness, while a break above, represented by a positive percentage, shows strength.
For hundreds of ETF choices, be sure to reference Thursday’s StatSheet.
For this current domestic “Buy” cycle, here’s how some our candidates have fared:
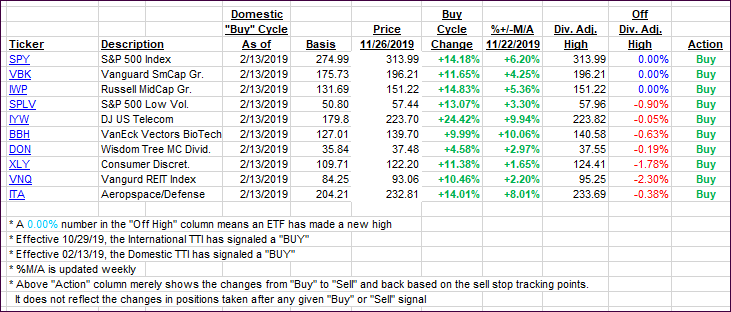
Again, the %+/-M/A column above shows the position of the various ETFs in relation to their respective long-term trend lines, while the trailing sell stops are being tracked in the “Off High” column. The “Action” column will signal a “Sell” once the -8% point has been taken out in the “Off High” column. For more volatile sector ETFs, the trigger point is -10%.
3. Trend Tracking Indexes (TTIs)
Our Trend Tracking Indexes (TTIs) went slightly opposite directions with the Domestic one gaining, while the International one slipped a tad.
Here’s how we closed 11/26/2019:
Domestic TTI: +6.41% above its M/A (prior close +6.29%)—Buy signal effective 02/13/2019
International TTI: +4.23% above its M/A (prior close +4.27%)—Buy signal effective 10/29/2019
Disclosure: I am obliged to inform you that I, as well as my advisory clients, own some of the ETFs listed in the above table. Furthermore, they do not represent a specific investment recommendation for you, they merely show which ETFs from the universe I track are falling within the specified guidelines.
Contact Ulli