
- Moving the markets
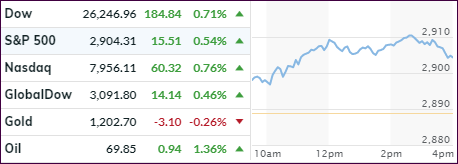
Just as quickly as trade war headlines pulled the markets off their lofty highs yesterday, negative sentiment reversed with the bulls refueling their gas tank and pushing the major indexes higher right after the opening bell.
It appears that global investors are favoring the US markets due to continued optimism about the outlook for not just corporate profits but also earnings growth, attributable in part due to the tax-cut bill of 2017.
Never mind that the 10-year bond yield knifed through the 3% level, after several attempts in the recent past, to close solidly above it at 3.05%, its highest point since May. That caused some pain for those holding bonds as part of their portfolio, as the 20-year bond ETF TLT got hammered at the tune of -1.05%. Remember, higher yields equal lower bond prices.
Investors chose to ignore the yield spike and simply kept on going with the bullish equity theme, as if higher bond yields were a good thing for stocks. Who knows how long that meme can last?
Wall Street traders also shrugged off the escalating trade tensions with China by focusing on one thing and one thing only and that was the assumption that this economy is “strong by any measures.” While this may seem odd in the face of previous market reactions, today nothing seemed to stand in the way of bullish sentiment.
While tomorrow may be an entirely different story, for this day, trade wars, imploding emerging market currencies, along with higher bond yields, were a non-event allowing the bulls to wipe out most of yesterday’s losses.
- ETFs in the Spotlight
In case you missed the announcement and description of this section, you can read it here again.
It features 10 broadly diversified and sector ETFs from my HighVolume list as posted every Saturday. Furthermore, they are screened for the lowest MaxDD% number meaning they have been showing better resistance to temporary sell offs than all others over the past year.
The below table simply demonstrates the magnitude with which some of the ETFs are fluctuating regarding their positions above or below their respective individual trend lines (%M/A). A break below, represented by a negative number, shows weakness, while a break above, represented by a positive percentage, shows strength.
For hundreds of ETF choices, be sure to reference Thursday’s StatSheet.
Year to date, here’s how our candidates have fared so far:
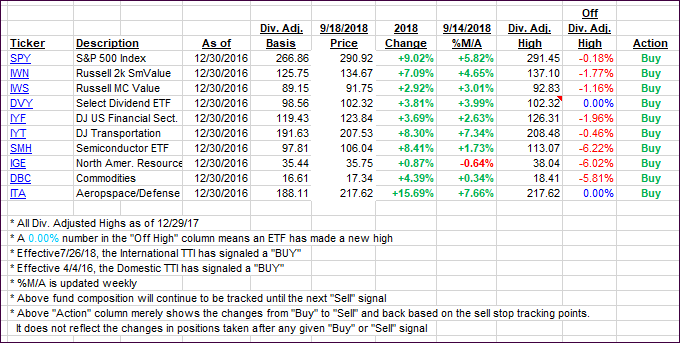
Again, the %M/A column above shows the position of the various ETFs in relation to their respective long-term trend lines, while the trailing sell stops are being tracked in the “Off High” column. The “Action” column will signal a “Sell” once the -8% point has been taken out in the “Off High” column. For more volatile sector ETFs, the trigger point is -10%.
- Trend Tracking Indexes (TTIs)
Our Trend Tracking Indexes (TTIs) headed higher with the bullish them being alive and well.
Here’s how we closed 09/18/2018:
Domestic TTI: +5.36% above its M/A (last close +4.90%)—Buy signal effective 4/4/2016
International TTI: +0.32% above its M/A (last close -0.13%)—Buy signal effective 7/26/2018
Disclosure: I am obliged to inform you that I, as well as my advisory clients, own some of the ETFs listed in the above table. Furthermore, they do not represent a specific investment recommendation for you, they merely show which ETFs from the universe I track are falling within the guidelines specified.
Contact Ulli