
- Moving the markets
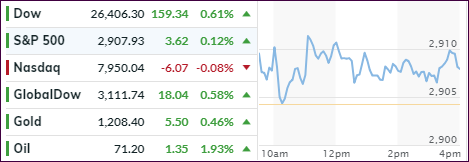
Yesterday’s divergence continued with bond yields spiking once more while the markets rallied, although the advance was mixed at best. While the Dow sprinted ahead by over 200 points intraday, the S&P barely held on to the unchanged line, while the Nasdaq hovered below it but managed some damage control towards the end of the session.
Cleary, the bond bears were in charge again with the 10-year yield rising 2 basis points to close at 3.08%, while testing seven-year highs. This 2-day yield spike was not a particularly well-kept secret, as global yields followed suit and surged as well reaching its highest level in 5 years, as this chart from ZH shows.
The fallout from all this was that bondholders got spanked, as the widely held 20-year Bond ETF, (TLT) slipped again and is now showing a loss of some -4.5% over the past few weeks—and this bearish trend may not be over yet.
For sure, the simultaneous advance in equities and bond yields can’t continue forever. Something is bound to give, which means that either bond yields continue to rise, and equities will head south or vice versa. To me, it shows that things are clearly out of whack, but they will surely correct—the timing of it is the big unknown.
- ETFs in the Spotlight
In case you missed the announcement and description of this section, you can read it here again.
It features 10 broadly diversified and sector ETFs from my HighVolume list as posted every Saturday. Furthermore, they are screened for the lowest MaxDD% number meaning they have been showing better resistance to temporary sell offs than all others over the past year.
The below table simply demonstrates the magnitude with which some of the ETFs are fluctuating regarding their positions above or below their respective individual trend lines (%M/A). A break below, represented by a negative number, shows weakness, while a break above, represented by a positive percentage, shows strength.
For hundreds of ETF choices, be sure to reference Thursday’s StatSheet.
Year to date, here’s how our candidates have fared so far:
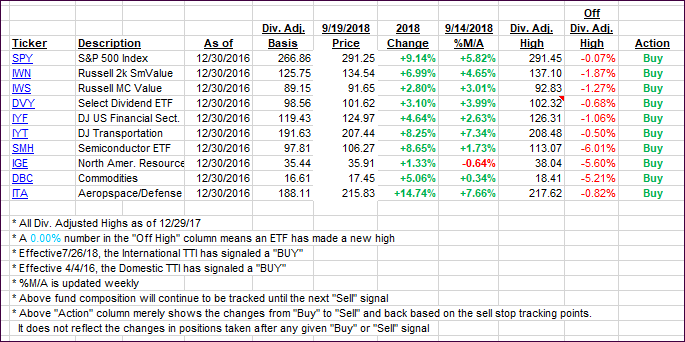
Again, the %M/A column above shows the position of the various ETFs in relation to their respective long-term trend lines, while the trailing sell stops are being tracked in the “Off High” column. The “Action” column will signal a “Sell” once the -8% point has been taken out in the “Off High” column. For more volatile sector ETFs, the trigger point is -10%.
- Trend Tracking Indexes (TTIs)
Our Trend Tracking Indexes (TTIs) were mixed with the Domestic one sliding a tad, while the International one jumped nicely and solidified its position on the bullish side of its trend line.
Here’s how we closed 09/19/2018:
Domestic TTI: +5.34% above its M/A (last close +5.36%)—Buy signal effective 4/4/2016
International TTI: +0.97% above its M/A (last close +0.32%)—Buy signal effective 7/26/2018
Disclosure: I am obliged to inform you that I, as well as my advisory clients, own some of the ETFs listed in the above table. Furthermore, they do not represent a specific investment recommendation for you, they merely show which ETFs from the universe I track are falling within the guidelines specified.
Contact Ulli