
- Moving the markets
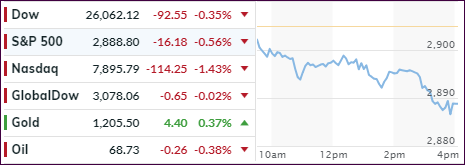
The tariff dispute with China intensified pulling the major indexes off their recent highs, as the tech sector got hammered with the Nasdaq dropping -1.43%, its worst day since late July.
The sudden re-appearance of the US/China trade battles rattled Wall Street, although the unveiling of the $200 billion in tariffs on Chinese products has not been exactly a secret, but with this looming threat not going away, investors decided enough is enough with this uncertainty and south we went.
Adding fuel to the fire was continued doubt as to how the Chinese might retaliate, especially while focusing their views on US corporations doing business in China. But, the fallout spread to the domestic arena as well, with some of the most influential companies, namely Apple and Amazon, getting punished at the tune of -2.7% and -3.2% respectively, which was their biggest loss since April.
This marks the first drop for the S&P 500 in five sessions, but the loss was a modest -0.56%. The FANGs led on the way down and experienced their biggest drop in 2 weeks while, at the same time, closing at a 1-month low.
The US 10-year Treasury yield meandered, crossed the glass ceiling of 3% intra-day but backed off to close below it. As this chart from ZH shows, the 10-year yield has closed higher only once since May 23rd. I believe that it will break through this resistance level soon which, once it does, may have a much-expected adverse impact on equities.
But, with computer algos overseeing the markets, you can never be sure these days about any potential outcome. Only time will tell…
- ETFs in the Spotlight
In case you missed the announcement and description of this section, you can read it here again.
It features 10 broadly diversified and sector ETFs from my HighVolume list as posted every Saturday. Furthermore, they are screened for the lowest MaxDD% number meaning they have been showing better resistance to temporary sell offs than all others over the past year.
The below table simply demonstrates the magnitude with which some of the ETFs are fluctuating regarding their positions above or below their respective individual trend lines (%M/A). A break below, represented by a negative number, shows weakness, while a break above, represented by a positive percentage, shows strength.
For hundreds of ETF choices, be sure to reference Thursday’s StatSheet.
Year to date, here’s how our candidates have fared so far:

Again, the %M/A column above shows the position of the various ETFs in relation to their respective long-term trend lines, while the trailing sell stops are being tracked in the “Off High” column. The “Action” column will signal a “Sell” once the -8% point has been taken out in the “Off High” column. For more volatile sector ETFs, the trigger point is -10%.
- Trend Tracking Indexes (TTIs)
Our Trend Tracking Indexes (TTIs) were mixed with the Domestic slipping and the International one gaining a tad.
Here’s how we closed 09/17/2018:
Domestic TTI: +4.90% above its M/A (last close +5.26%)—Buy signal effective 4/4/2016
International TTI: -0.13% below its M/A (last close -0.17%)—Buy signal effective 7/26/2018
Disclosure: I am obliged to inform you that I, as well as my advisory clients, own some of the ETFs listed in the above table. Furthermore, they do not represent a specific investment recommendation for you, they merely show which ETFs from the universe I track are falling within the guidelines specified.
Contact Ulli