
- Moving the markets
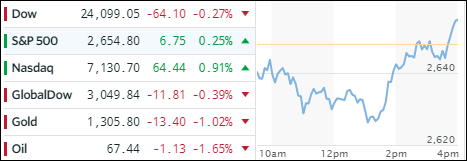
In a reversal of what we have seen lately, the markets dug themselves a hole early on but managed to climb out of it during the afternoon with the Nasdaq and S&P 500 actually closing in the green. It was a quiet session with most of the world being on the sidelines due to the May Day Holiday.
It was a mixed picture with the clear winner being the Nasdaq, even though Apples’ earnings are still on deck and won’t be out till after the close. The Dow ended in the red thanks to a weak McDonald’s report card while possible trade talk repercussions pulled Boeing down by -1.22%.
Interest rates rose today with the 10-year bond yield climbing a modest 2 basis points to end at 2.97%. Showing continued and surprising strength was the US Dollar (UUP +0.66%), which has now sliced through its 200-day M/A to the upside and thereby shows bullish ambitions. Opinions still vary as to whether this move up is sustainable or not considering the drop UUP has seen over the past 15 months.
The Fed will be in the limelight during its 2-day meeting until the results regarding interest rates will be made public tomorrow at 11 am EST. They are expected to hold the course on rates and signal no change for the time being, but, you can never be sure.
- ETFs in the Spotlight
In case you missed the announcement and description of this section, you can read it here again.
It features 10 broadly diversified and sector ETFs from my HighVolume list as posted every Saturday. Furthermore, they are screened for the lowest MaxDD% number meaning they have been showing better resistance to temporary sell offs than all others over the past year.
The below table simply demonstrates the magnitude with which some of the ETFs are fluctuating in regards to their positions above or below their respective individual trend lines (%M/A). A break below, represented by a negative number, shows weakness, while a break above, represented by a positive percentage, shows strength.
For hundreds of ETF choices, be sure to reference Thursday’s StatSheet.
Year to date, here’s how our candidates have fared so far:
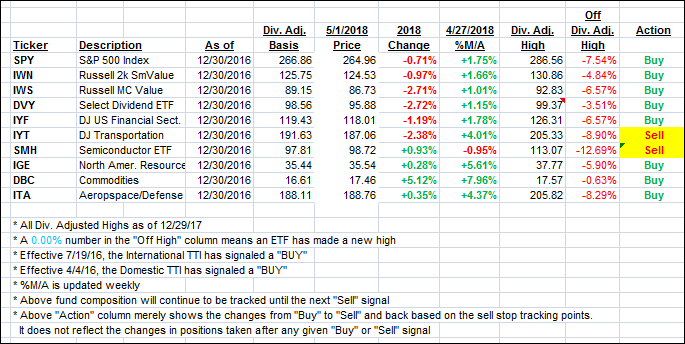
Again, the %M/A column above shows the position of the various ETFs in relation to their respective long term trend lines, while the trailing sell stops are being tracked in the “Off High” column. The “Action” column will signal a “Sell” once the -7.5% point has been taken out in the “Off High” column.
- Trend Tracking Indexes (TTIs)
Our Trend Tracking Indexes (TTIs) were mixed with the Domestic one gaining and the International one losing.
Here’s how we closed 05/01/2018:
Domestic TTI: +0.92% above its M/A (last close +0.73%)—Buy signal effective 4/4/2016
International TTI: +1.29% below its M/A (last close +1.34%)—Buy signal effective 7/19/2016
Disclosure: I am obliged to inform you that I, as well as my advisory clients, own some of the ETFs listed in the above table. Furthermore, they do not represent a specific investment recommendation for you, they merely show which ETFs from the universe I track are falling within the guidelines specified.
Contact Ulli