
- Moving the markets
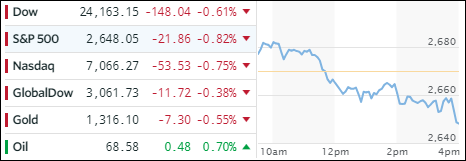
As has been the meme for the past few weeks, an early rally gave way mid-day to a broad sell-off despite positive earnings reports, which simply could not stem the downward momentum. Several last minute attempts to reverse the tide failed, and the major indexes dove into close scoring the lows for the session.
25 of the 30 Dow components ended up in the red, joined by all 11 S&P sectors, the downside leader of which was Healthcare with -1.6%. Even energy, which previously had shown some strength due to the uncertainty in the Middle East, had no bullish support and ended flat.
For April, the returns for the major indexes were anything but noteworthy, but at least we eked out some green numbers. The Dow added 0.3%, as did the S&P 500, while the Nasdaq scored a gain of less than 0.1%
So far, more than 50% of the S&P’s companies have shown their report cards with 79% of them beating Wall Street’s expectations. That is a solid percentage, which makes it somewhat concerning that the markets are showing nothing but a lackluster attitude and reaction to good earnings.
Of course, let’s not forget the host of distractions that have placed a blanket of worry over Wall Street. I am talking about protectionism and geopolitics along with concerns that global economic growth might be slowing down further. Higher bond yields are not supporting the bullish equity theme, although over the past few trading session, we’ve seen the 10-year yield back off from its 3% level, which is widely recognized as a hindrance to further upswings in the equity market.
While our Trend Tracking Indexes (TTIs) are still in “Buy” mode, we now have reached a level where we reside in striking distance of a new “Sell” signal. I have no idea whether that event will materialize in May, but I am prepared to act should a signal be given.
- ETFs in the Spotlight
In case you missed the announcement and description of this section, you can read it here again.
It features 10 broadly diversified and sector ETFs from my HighVolume list as posted every Saturday. Furthermore, they are screened for the lowest MaxDD% number meaning they have been showing better resistance to temporary sell offs than all others over the past year.
The below table simply demonstrates the magnitude with which some of the ETFs are fluctuating in regards to their positions above or below their respective individual trend lines (%M/A). A break below, represented by a negative number, shows weakness, while a break above, represented by a positive percentage, shows strength.
For hundreds of ETF choices, be sure to reference Thursday’s StatSheet.
Year to date, here’s how our candidates have fared so far:
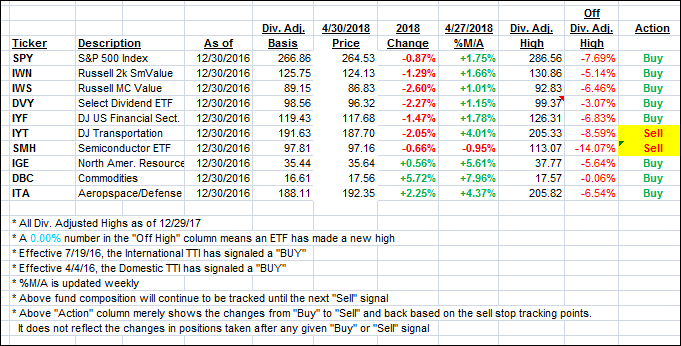
Again, the %M/A column above shows the position of the various ETFs in relation to their respective long term trend lines, while the trailing sell stops are being tracked in the “Off High” column. The “Action” column will signal a “Sell” once the -7.5% point has been taken out in the “Off High” column.
- Trend Tracking Indexes (TTIs)
Our Trend Tracking Indexes (TTIs) dropped as the markets could not maintain their early positive bias.
Here’s how we closed 4/30/2018:
Domestic TTI: +0.73% above its M/A (last close +1.02%)—Buy signal effective 4/4/2016
International TTI: +1.34% below its M/A (last close +1.60%)—Buy signal effective 7/19/2016
Disclosure: I am obliged to inform you that I, as well as my advisory clients, own some of the ETFs listed in the above table. Furthermore, they do not represent a specific investment recommendation for you, they merely show which ETFs from the universe I track are falling within the guidelines specified.
Contact Ulli