
- Moving the markets
You would have expected the markets to show some signs of life with Apple posting better than expected earnings and revenue after the close yesterday. Or, that the Fed’s statement was interpreted as somewhat dovish despite saying that further rate hikes are “needed in the coming months.”
If you thought that, you were wrong. Maybe it was because Apple’s glowing report card was simply a result of some $22.88 billion in buybacks of its own shares in Q1 along with doling out another $3.2 billion in dividends. To put this in perspective, according to ZH, the amount of stock bought back by Apple is larger than the market cap of 275 of the 500 companies in the S&P 500 index.
Or, maybe confusion reigned supreme when the Fed statement mentioned the words “symmetric inflation objective,” and traders and algos alike had to scramble to figure out what that meant.
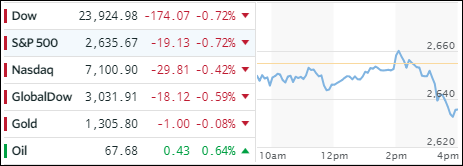
Be that as it may, in times of uncertainty, the markets tend to take the way of least resistance, which is down. That’s what happened, and the major indexes headed south and closed near their lows of the day.
Interest rates were mixed with the 10-year bond yield remaining unchanged at 2.97%. Having a wild day was the US Dollar (UUP), which dumped sharply and then recovered to rally +0.45%.
This turned out to be another session that pushed our Trend Tracking Indexes (TTIs) closer to a potential “Sell” signal. Please see section 3 below for the exact details.
- ETFs in the Spotlight
In case you missed the announcement and description of this section, you can read it here again.
It features 10 broadly diversified and sector ETFs from my HighVolume list as posted every Saturday. Furthermore, they are screened for the lowest MaxDD% number meaning they have been showing better resistance to temporary sell offs than all others over the past year.
The below table simply demonstrates the magnitude with which some of the ETFs are fluctuating in regards to their positions above or below their respective individual trend lines (%M/A). A break below, represented by a negative number, shows weakness, while a break above, represented by a positive percentage, shows strength.
For hundreds of ETF choices, be sure to reference Thursday’s StatSheet.
Year to date, here’s how our candidates have fared so far:
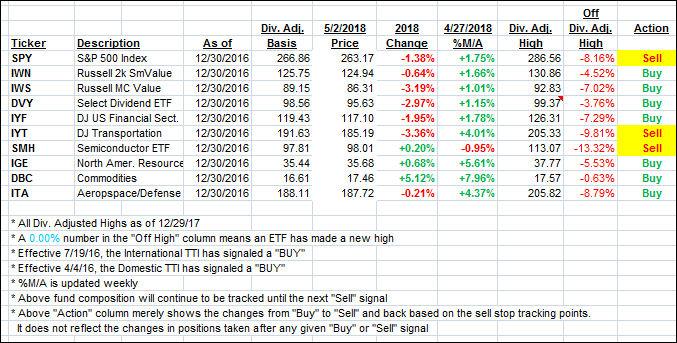
Again, the %M/A column above shows the position of the various ETFs in relation to their respective long term trend lines, while the trailing sell stops are being tracked in the “Off High” column. The “Action” column will signal a “Sell” once the -7.5% point has been taken out in the “Off High” column.
- Trend Tracking Indexes (TTIs)
Our Trend Tracking Indexes (TTIs) slipped as the sour mood in the markets continued.
Here’s how we closed 05/02/2018:
Domestic TTI: +0.78% above its M/A (last close +0.92%)—Buy signal effective 4/4/2016
International TTI: +1.01% below its M/A (last close +1.29%)—Buy signal effective 7/19/2016
Disclosure: I am obliged to inform you that I, as well as my advisory clients, own some of the ETFs listed in the above table. Furthermore, they do not represent a specific investment recommendation for you, they merely show which ETFs from the universe I track are falling within the guidelines specified.
Contact Ulli