
- Moving the markets
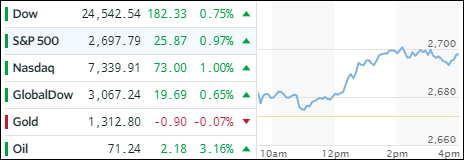
You never know what motivates traders to push the markets higher. After Trump’s withdrawal from the Iran nuclear pact, and massive preceding requests by world leaders not to follow through with it, you would have expected the markets to have hissy-fit. They did, but to the upside and with help of the VIX, which was spanked to the 13 level and thereby assisted the bulls to have it their way.
Technically speaking, the recent glass ceiling, namely the 50-day M/A of the S&P 500, was taken out today indicating that we may break out of the trading range I’ve been posting about. However, a little more work is needed to confirm that this was not a one day pony show.
Nothing seemed to be able to stop this rally, not even the fact that interest rates rose with the 10-year bond yield gaining 3 basis points to close at 3.00% on the money. Energy shares took top billing, but we saw broad based gains in financials, materials and technology sectors. Lagging on the day were telecoms and utilities.
- ETFs in the Spotlight
In case you missed the announcement and description of this section, you can read it here again.
It features 10 broadly diversified and sector ETFs from my HighVolume list as posted every Saturday. Furthermore, they are screened for the lowest MaxDD% number meaning they have been showing better resistance to temporary sell offs than all others over the past year.
The below table simply demonstrates the magnitude with which some of the ETFs are fluctuating in regards to their positions above or below their respective individual trend lines (%M/A). A break below, represented by a negative number, shows weakness, while a break above, represented by a positive percentage, shows strength.
For hundreds of ETF choices, be sure to reference Thursday’s StatSheet.
Year to date, here’s how our candidates have fared so far:
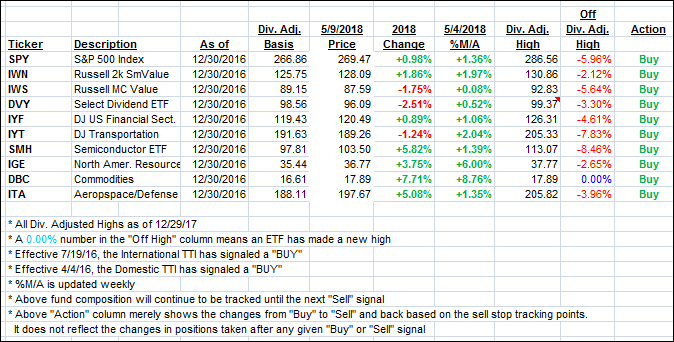
Again, the %M/A column above shows the position of the various ETFs in relation to their respective long term trend lines, while the trailing sell stops are being tracked in the “Off High” column. The “Action” column will signal a “Sell” once the -7.5% point has been taken out in the “Off High” column.
- Trend Tracking Indexes (TTIs)
Our Trend Tracking Indexes (TTIs) headed north with the bulls ignoring higher bond yields.
Here’s how we closed 05/09/2018:
Domestic TTI: +1.85% above its M/A (last close +1.54%)—Buy signal effective 4/4/2016
International TTI: +2.21% below its M/A (last close +1.64%)—Buy signal effective 7/19/2016
Disclosure: I am obliged to inform you that I, as well as my advisory clients, own some of the ETFs listed in the above table. Furthermore, they do not represent a specific investment recommendation for you, they merely show which ETFs from the universe I track are falling within the guidelines specified.
Contact Ulli