
- Moving the markets
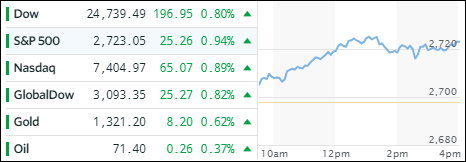
Muted inflation fears were one part of the puzzle that helped the markets score another win with the major indexes gaining across the board.
First, today’s reading on April consumer prices came in at +0.1%, which was a tad below estimates. Second, the 10-year bond yield pulled back and did not close above the much feared 3% level. Third, to make sure the markets were going to close in the green, the VIX was clubbed again and tumbled to 12 from yesterday’s 13 level.
This triple combination was enough to control any bearish thoughts and let the bulls have another chest pounding session. Even news headlines that 2 of the biggest hedge fund managers opined that “This is not a time to be rewarded for long market exposure…” while announcing their increased short holdings, did nothing to reduce the bullish fever—at least not yet.
Despite market anxieties appearing to have taken a step back, the jury is still out as to whether this will be a resumption of the prior bull market or, as some fund managers believe, simply a sign of a blow off top.
While gold and oil edged higher as well, the US Dollar (UUP) got spanked and lost -0.47%, its biggest drop in 2 months. However, due to its recent rebound, UUP is still positioned on the positive side of its 50- and 200-day M/As.
- ETFs in the Spotlight
In case you missed the announcement and description of this section, you can read it here again.
It features 10 broadly diversified and sector ETFs from my HighVolume list as posted every Saturday. Furthermore, they are screened for the lowest MaxDD% number meaning they have been showing better resistance to temporary sell offs than all others over the past year.
The below table simply demonstrates the magnitude with which some of the ETFs are fluctuating in regards to their positions above or below their respective individual trend lines (%M/A). A break below, represented by a negative number, shows weakness, while a break above, represented by a positive percentage, shows strength.
For hundreds of ETF choices, be sure to reference Thursday’s StatSheet.
Year to date, here’s how our candidates have fared so far:
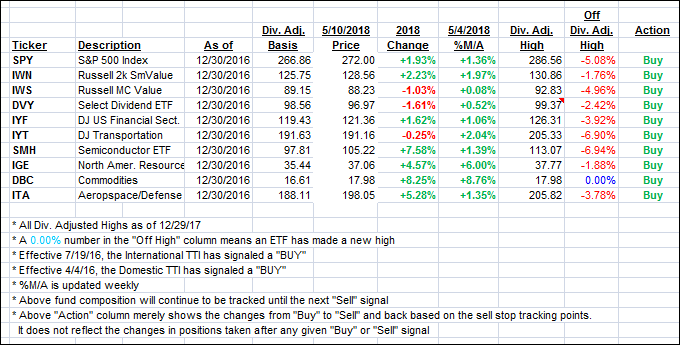
Again, the %M/A column above shows the position of the various ETFs in relation to their respective long term trend lines, while the trailing sell stops are being tracked in the “Off High” column. The “Action” column will signal a “Sell” once the -8% point has been taken out in the “Off High” column.
- Trend Tracking Indexes (TTIs)
Our Trend Tracking Indexes (TTIs) continued heading higher.
Here’s how we closed 05/10/2018:
Domestic TTI: +2.16% above its M/A (last close +1.85%)—Buy signal effective 4/4/2016
International TTI: +2.88% below its M/A (last close +2.21%)—Buy signal effective 7/19/2016
Disclosure: I am obliged to inform you that I, as well as my advisory clients, own some of the ETFs listed in the above table. Furthermore, they do not represent a specific investment recommendation for you, they merely show which ETFs from the universe I track are falling within the guidelines specified.
Contact Ulli