
- Moving the markets
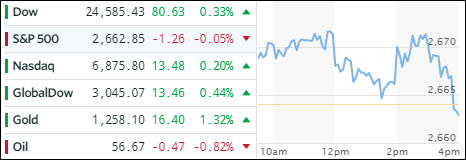
Early market exuberance faded late in the session with only the Dow and Nasdaq clinging on to modest gains, while the S&P 500 slipped slightly into the red. The Fed raised the benchmark Fed funds rate by 0.25%, as expected, which was the fourth hike in the past year. The much awaited 2018 forecast in regards to inflation and interest rates was a nothing burger, as they stuck to previously announced plans to hike rates three times.
As a result, equities pulled back and our ETF space ended up with mostly green numbers. Taking leadership was Emerging Markets (SCHE) with a solid +1.02% with International SmallCaps (SCHC) occupying second place with +0.58%. On the downside, we saw a reversal in that Financials (XLF -1.24%) gave back yesterday’s gains; also ending in the red was MidCaps (SCHM) with -0.21%.
Interest rates took a dive with the yield on the 10-year bond losing 4 basis points to 2.36%. That allowed the 20-year bond (TLT) to rally +0.75% and reversing a two-day downtrend. Gold glittered today by adding a solid +1.32%, but it ended the session just short of reclaiming its 50-day M/A. The US Dollar (UUP), on the other hand, took a dive by losing -0.69%, which was its first down day in 7 sessions. It also meant that it broke back below its 50-day M/A.
- ETFs in the Spotlight
In case you missed the announcement and description of this section, you can read it here again.
It features 10 broadly diversified and sector ETFs from my HighVolume list as posted every Saturday. Furthermore, they are screened for the lowest MaxDD% number meaning they have been showing better resistance to temporary sell offs than all others over the past year.
The below table simply demonstrates the magnitude with which some of the ETFs are fluctuating in regards to their positions above or below their respective individual trend lines (%M/A). A break below, represented by a negative number, shows weakness, while a break above, represented by a positive percentage, shows strength.
For hundreds of ETF choices, be sure to reference Thursday’s StatSheet.
Year to date, here’s how the 2017 candidates have fared so far:
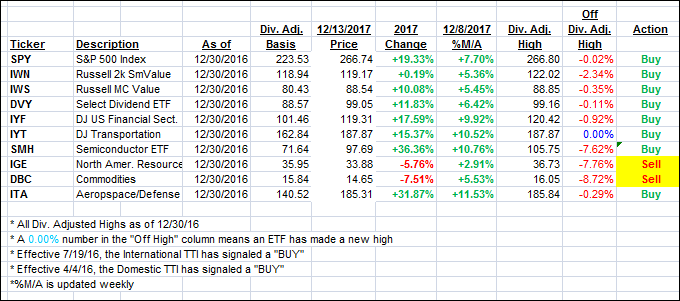
Again, the %M/A column above shows the position of the various ETFs in relation to their respective long term trend lines, while the trailing sell stops are being tracked in the “Off High” column. The “Action” column will signal a “Sell” once the -7.5% point has been taken out in the “Off High” column.
- Trend Tracking Indexes (TTIs)
Our Trend Tracking Indexes (TTIs) headed higher as gainers outscored losers today.
Here’s how we closed 12/13/2017:
Domestic TTI: +3.57% above its M/A (last close +3.44%)—Buy signal effective 4/4/2016
International TTI: +5.89% above its M/A (last close +5.72%)—Buy signal effective 7/19/2016
Disclosure: I am obliged to inform you that I, as well as my advisory clients, own some of the ETFs listed in the above table. Furthermore, they do not represent a specific investment recommendation for you, they merely show which ETFs from the universe I track are falling within the guidelines specified.
Contact Ulli