
- Moving the markets
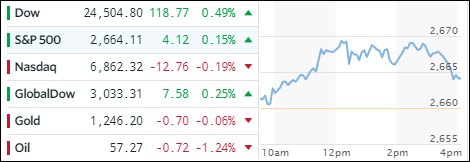
In a repeat from yesterday, the Dow and S&P 500 climbed into record territory for the fourth session a row, while the Nasdaq bucked the trend and slipped a tad. While tomorrow’s announcement by the Fed about a 0.25% rate hike is a foregone conclusion, some anxiousness prevails about what signals may be given about 2018 and how the Fed views the economic conditions.
While MSM did not cover much in regards to the eruption of US Producer prices, at the fastest pace in six years, it nevertheless was a big headline with a year over year surge of 3.01%. Energy played a big role with final demand climbing 4.6%.
In ETF space, the numbers were mixed but fairly balanced. Gaining strongly were Financials (XLF) with +1.00% followed by Aerospace & Defense (ITA) with +0.36%. With the Nasdaq slipping, it was no surprise that Semiconductors (SMH) fell as well and lost -0.98% with Emerging Markets (SCHE) giving back -0.58%.
The yield on the 10-year bond rose 1 basis point, Crude Oil took a hit and gold desperately tried to climb above the $1,350 level but failed. The US Dollar (UUP) continued its recent rebound for the seventh straight day and is now solidly entrenched above its 50-day M/A.
- ETFs in the Spotlight
In case you missed the announcement and description of this section, you can read it here again.
It features 10 broadly diversified and sector ETFs from my HighVolume list as posted every Saturday. Furthermore, they are screened for the lowest MaxDD% number meaning they have been showing better resistance to temporary sell offs than all others over the past year.
The below table simply demonstrates the magnitude with which some of the ETFs are fluctuating in regards to their positions above or below their respective individual trend lines (%M/A). A break below, represented by a negative number, shows weakness, while a break above, represented by a positive percentage, shows strength.
For hundreds of ETF choices, be sure to reference Thursday’s StatSheet.
Year to date, here’s how the 2017 candidates have fared so far:
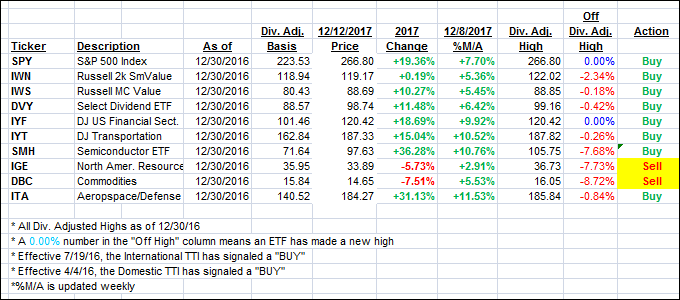
Again, the %M/A column above shows the position of the various ETFs in relation to their respective long term trend lines, while the trailing sell stops are being tracked in the “Off High” column. The “Action” column will signal a “Sell” once the -7.5% point has been taken out in the “Off High” column.
- Trend Tracking Indexes (TTIs)
Our Trend Tracking Indexes (TTIs) barely changed as the overall picture was mixed.
Here’s how we closed 12/12/2017:
Domestic TTI: +3.44% above its M/A (last close +3.43%)—Buy signal effective 4/4/2016
International TTI: +5.72% above its M/A (last close +5.58%)—Buy signal effective 7/19/2016
Disclosure: I am obliged to inform you that I, as well as my advisory clients, own some of the ETFs listed in the above table. Furthermore, they do not represent a specific investment recommendation for you, they merely show which ETFs from the universe I track are falling within the guidelines specified.
Contact Ulli