
- Moving the markets
Market exuberance reigned early on and had the major indexes on track to set more record highs when jawboning by senators Rubio and Lee caused a case of severe tax-reform-anxiety. While we all thought the tax reform was a done deal, it does not appear so as questions regarding the “child tax credit” caused Lee to announce that he’s undecided and Rubio declaring a “No” vote unless changes are made.
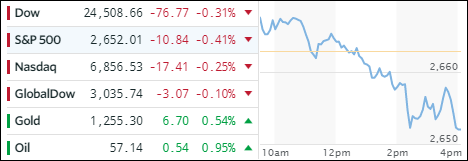
That’s all it took, and the markets went into reversal mode and headed for the basement with prices ending at the day’s lows. In the bigger scheme of things the losses were small but losses nonetheless. In ETF space, we only saw red numbers. Giving back the most were US SmallCaps (SCHA) with -1.01% followed by Transportations (IYT) and Financials (XLF) with -0.71% and -0.65% respectively. Holding up the best were Semiconductors (SMH) with -0.04%.
Interest rates were mixed but the 20-year bond (TLT) outperformed by gaining +0.48%, while the High Yield sector (HYG) went the other way, traded in a wide range but only -0.21%. Gold continued its recovery and Crude Oil was solid with a +0.95% gain. The US Dollar (UUP) round tripped and faded into the close but managed to rebound +0.08%.
- ETFs in the Spotlight
In case you missed the announcement and description of this section, you can read it here again.
It features 10 broadly diversified and sector ETFs from my HighVolume list as posted every Saturday. Furthermore, they are screened for the lowest MaxDD% number meaning they have been showing better resistance to temporary sell offs than all others over the past year.
The below table simply demonstrates the magnitude with which some of the ETFs are fluctuating in regards to their positions above or below their respective individual trend lines (%M/A). A break below, represented by a negative number, shows weakness, while a break above, represented by a positive percentage, shows strength.
For hundreds of ETF choices, be sure to reference Thursday’s StatSheet.
Year to date, here’s how the 2017 candidates have fared so far:
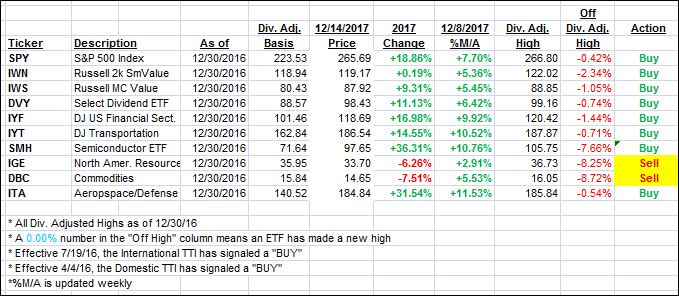
Again, the %M/A column above shows the position of the various ETFs in relation to their respective long term trend lines, while the trailing sell stops are being tracked in the “Off High” column. The “Action” column will signal a “Sell” once the -7.5% point has been taken out in the “Off High” column.
- Trend Tracking Indexes (TTIs)
Our Trend Tracking Indexes (TTIs) retrace recent gains as the markets provided a mixed picture.
Here’s how we closed 12/14/2017:
Domestic TTI: +3.39% above its M/A (last close +3.57%)—Buy signal effective 4/4/2016
International TTI: +4.90% above its M/A (last close +5.89%)—Buy signal effective 7/19/2016
Disclosure: I am obliged to inform you that I, as well as my advisory clients, own some of the ETFs listed in the above table. Furthermore, they do not represent a specific investment recommendation for you, they merely show which ETFs from the universe I track are falling within the guidelines specified.
Contact Ulli