
ETF Tracker StatSheet
You can view the latest version here.
CHIP STOCKS SINK NASDAQ AS GEOPOLITICAL RISKS RATTLE MARKETS
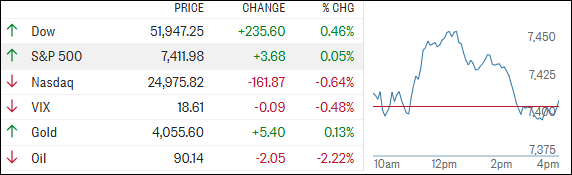
[Chart courtesy of MarketWatch.com]
- Moving the market
It was a challenging end to the week for the major indexes, with the Nasdaq once again taking the brunt of the selling pressure as weakness in semiconductor stocks weighed heavily on the tech sector.
Chip stocks got off to a shaky start after Intel initially rallied on better-than-expected second-quarter results, only to reverse course and finish down 4%.
The selling spread across the sector, with Broadcom and AMD each losing 2%, Micron dropping 6%, and the VanEck Semiconductor ETF (SMH) falling 2%. After months of leading the market higher, semiconductors found themselves firmly in the crosshairs.
The broader market remained on edge following Thursday’s selloff, when the Dow tumbled more than 500 points and both the S&P 500 and Nasdaq suffered their largest one-day declines since late June.
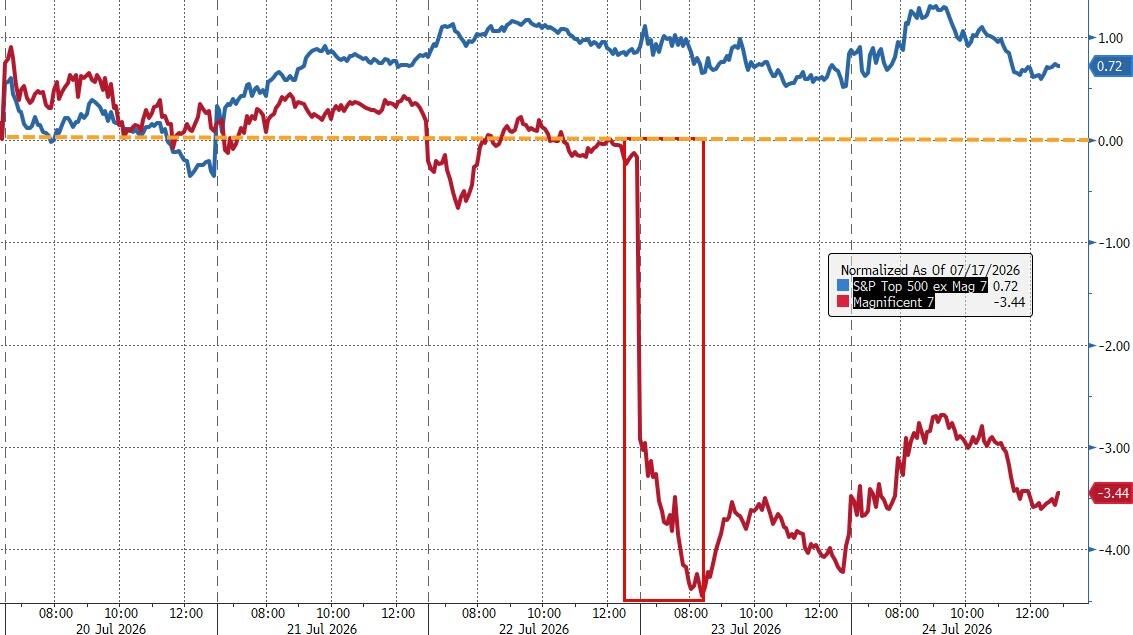
Disappointing reactions to earnings from Tesla and Alphabet have raised questions about whether the market’s biggest winners can continue carrying the rally.
Adding to investor unease were rising geopolitical tensions in the Middle East. President Trump indicated he is considering a major military response against Iran as the conflict continues to expand into the Red Sea region.
Markets dislike uncertainty, and right now traders are being forced to react to a constant stream of geopolitical headlines that can change sentiment in a matter of minutes.
By the closing bell, the Dow managed to stay in positive territory, while the S&P 500 finished little changed.
The Nasdaq, however, ended lower under the weight of chip stocks. For the week, all three major indexes finished in the red, with the Mag 7 notably underperforming the rest of the market.
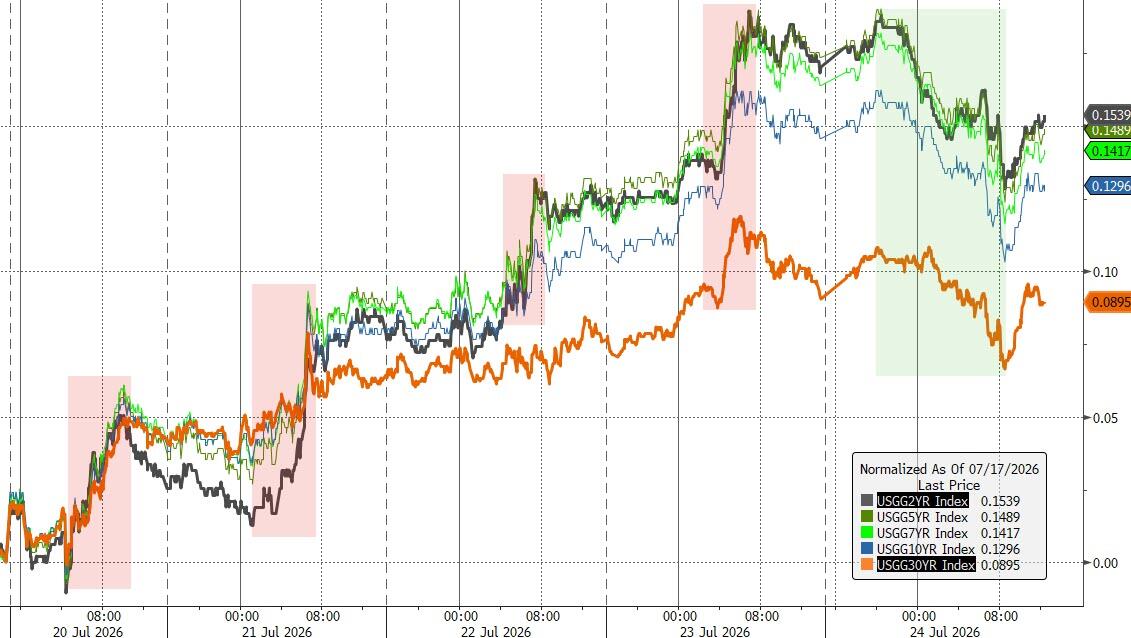
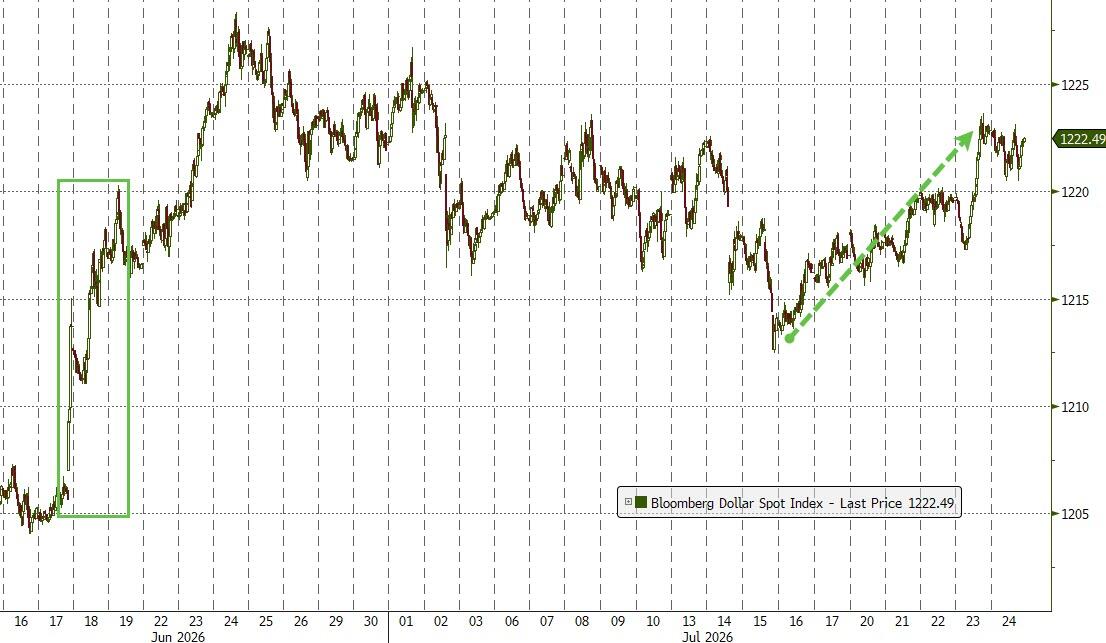
Outside of equities, bond yields moved higher alongside oil prices, while the dollar posted its strongest weekly performance in more than a month.
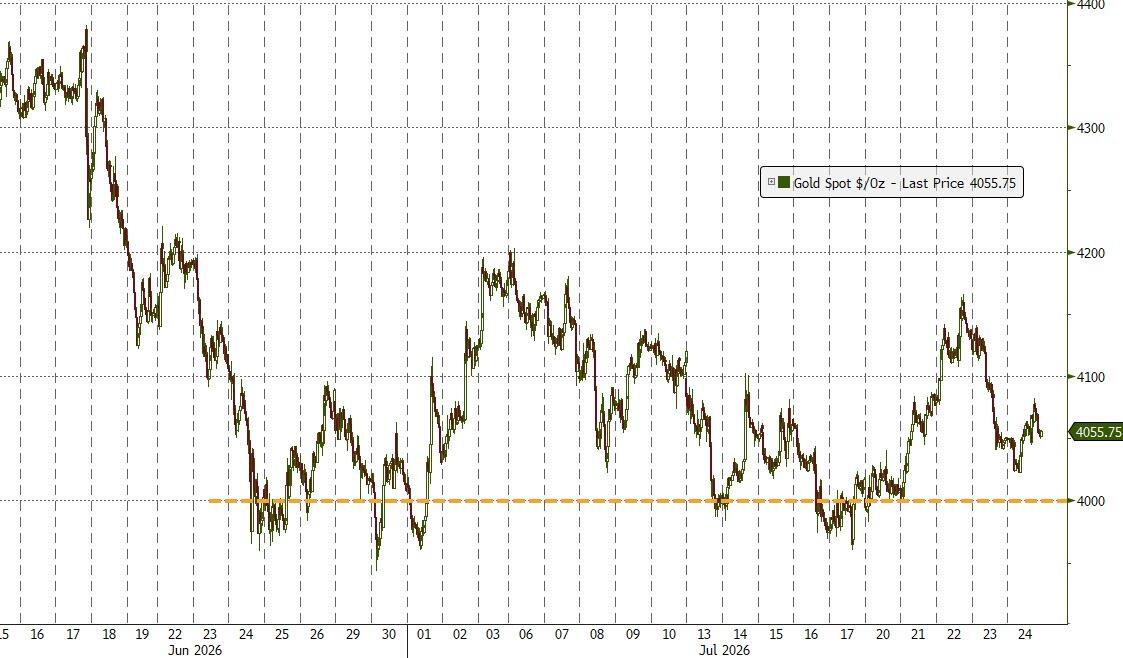
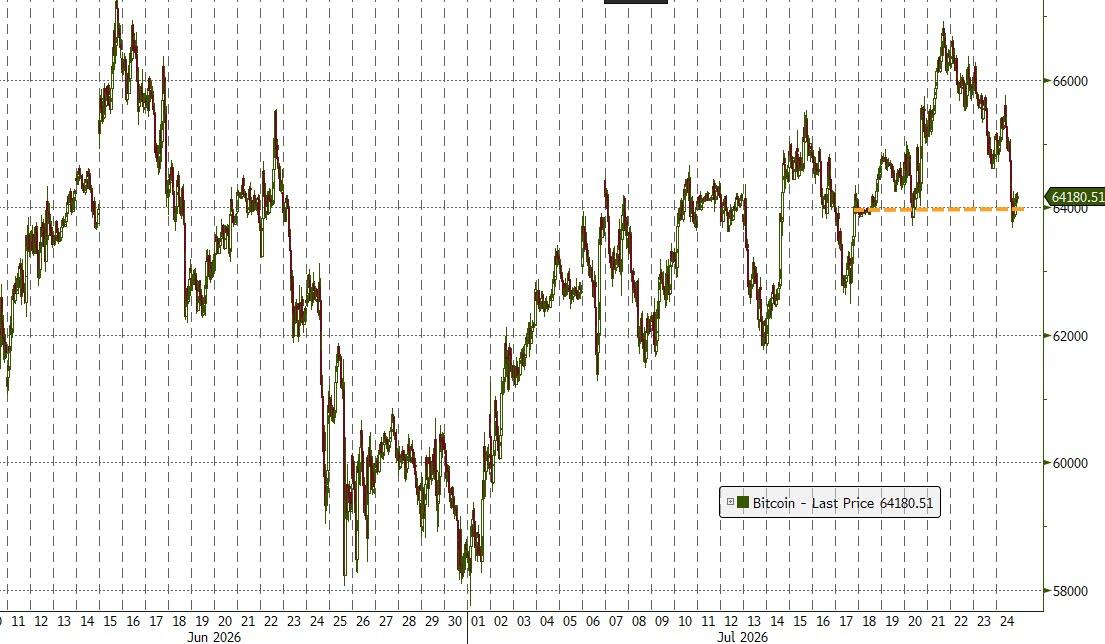
Gold recovered to finish above $4,000 an ounce, although well below its intraday highs. Bitcoin briefly tested its mid-June highs before fading and ending the session roughly flat.
One development that may deserve more attention is the growing disruption to global shipping routes in the Middle East. Traffic through the Strait of Hormuz has slowed dramatically as tensions in and around the Persian Gulf intensify.
With only six ships passing through the strait on Thursday, the lowest level since early May, the potential impact on energy markets and future oil prices is becoming harder to ignore.
With earnings season losing some momentum, geopolitical risks rising, and markets increasingly reacting to each new headline, the key question remains: Can traders keep their confidence in stocks, or is a more cautious stance beginning to make sense?
2. Current domestic “Buy” Cycle (effective 5/20/2025); International “Buy” Cycle (effective 5/8/25)
Our domestic bullish cycle that began on November 21, 2023, concluded on April 3, 2025, following a market downturn triggered by President Trump’s tariff policy announcement.
This development caused significant declines across major indexes and broader market indices. However, markets subsequently rebounded, culminating in a new domestic “Buy” signal taking effect May 20, 2025.
Concurrently, our International Trend Tracking Index (TTI) experienced parallel volatility. On April 4, 2025, it breached critical thresholds, prompting a “Sell” recommendation. This position reversed as global markets recovered, with the International TTI regaining sufficient momentum to issue a new “Buy” signal effective May 8, 2025.
3. Trend Tracking Indexes (TTIs)
The bears were back at it again today, taking another swipe at the tech sector and pushing the Nasdaq to yet another red close.
Not everything was down, though. Metals held up well against the broader weakness, and our TTIs also had a good day, led by the domestic TTI, which posted an impressive gain.
This is how we closed 07/24/2026:
Domestic TTI: +7.49% above its M/A (prior close +7.00%)—Buy signal effective 5/20/25.
International TTI: +6.05% above its M/A (prior close +6.16%)—Buy signal effective 5/8/25.
All linked charts above are courtesy of Bloomberg via ZeroHedge.
———————————————————-
WOULD YOU LIKE TO HAVE YOUR INVESTMENTS PROFESSIONALLY MANAGED?
Do you have the time to follow our investment plans yourself? If you are a busy professional who would like to have his portfolio managed using our methodology, please contact me directly to get more details.
Contact Ulli