
- Moving the markets
Overnight exuberance, caused in part by the discovery that Friday’s story from ABC about former national-security advisor Flynn was “fake news”, only had a temporary market moving effect. But clearly helping the bullish cause was the weekend passage of the Senate version’s overhaul of the tax code.
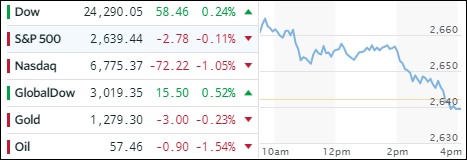
Spoiling the party was the continuation of the tech wreck, which pulled the Nasdaq down by another -1.05%. Only the Dow managed to buck the trend by closing slightly in the green after having been up over 200 points early on.
In the end, we saw more losers than winners in ETF space, although the bottom line was just about even. Scoring nicely were Transporations (IYT +1.81%) and Financials (XLF +1.52%). On the downside, Semiconductors (SMH) continued their slide with -2.12% while International SmallCaps (SCHC) gave back -0.65%. Semiconductors are now getting close to triggering their trailing sell stops, and we will liquidate them once that event occurs. Remember, they have been our top performer YTD, and a sale will leave us with a nice profit.
Interest rates bobbed and weaved, but the yield on the 10-year bond remained unchanged. Gold dropped and Crude Oil lost, while the US dollar (UUP) was steady and added +0.33% for the day.
- ETFs in the Spotlight (updated for 2017)
In case you missed the announcement and description of this section, you can read it here again.
It features 10 broadly diversified and sector ETFs from my HighVolume list as posted every Saturday. Furthermore, they are screened for the lowest MaxDD% number meaning they have been showing better resistance to temporary sell offs than all others over the past year.
The below table simply demonstrates the magnitude with which some of the ETFs are fluctuating in regards to their positions above or below their respective individual trend lines (%M/A). A break below, represented by a negative number, shows weakness, while a break above, represented by a positive percentage, shows strength.
For hundreds of ETF choices, be sure to reference Thursday’s StatSheet.
Year to date, here’s how the 2017 candidates have fared so far:
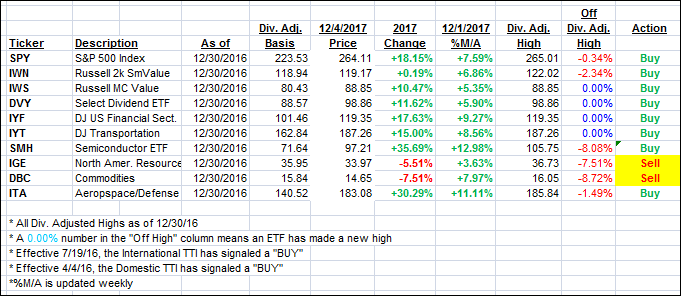
Again, the %M/A column above shows the position of the various ETFs in relation to their respective long term trend lines, while the trailing sell stops are being tracked in the “Off High” column. The “Action” column will signal a “Sell” once the -7.5% point has been taken out in the “Off High” column.
- Trend Tracking Indexes (TTIs)
Our Trend Tracking Indexes (TTIs) slipped as the major indexes ended the day mixed.
Here’s how we closed 12/04/2017:
Domestic TTI: +3.26% above its M/A (last close +3.48%)—Buy signal effective 4/4/2016
International TTI: +5.24% above its M/A (last close +5.44%)—Buy signal effective 7/19/2016
Disclosure: I am obliged to inform you that I, as well as my advisory clients, own some of the ETFs listed in the above table. Furthermore, they do not represent a specific investment recommendation for you, they merely show which ETFs from the universe I track are falling within the guidelines specified.
Contact Ulli