
- Moving the markets
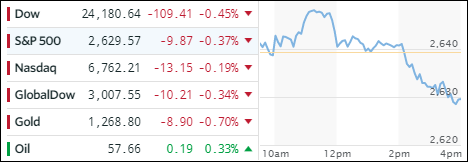
The Nasdaq powered ahead early in the session as the Dow and S&P 500 struggled to find some traction. However, the euphoria was short lived as mid-day selling pulled all three indexes lower and below the unchanged line.
Tranportations (IYT), who had put up some strong numbers in recent days, under-performed and lost -1.40%. Most ETFs ended up with red numbers as SmallCaps (SCHA) and Aerospace and Defense (ITA) gave back -0.96% and -0.80% respectively. The winner of the day ended up being Semiconductors (SMH), which remained unchanged. That’s was as good as it got.
Treasury yields were lower allowing the 20-year bond (TLT) to rally +0.50%, while the high yield complex (HYG) slightly dropped and stayed just below its 50-day M/A. The Dollar index (UUP) rallied today +0.16% but is stuck in a tight range for the past 5 trading days. Precious metals were slammed again with gold not only closing below its 200-day M/A but also touching lows last seen 4 months ago.
- ETFs in the Spotlight (updated for 2017)
In case you missed the announcement and description of this section, you can read it here again.
It features 10 broadly diversified and sector ETFs from my HighVolume list as posted every Saturday. Furthermore, they are screened for the lowest MaxDD% number meaning they have been showing better resistance to temporary sell offs than all others over the past year.
The below table simply demonstrates the magnitude with which some of the ETFs are fluctuating in regards to their positions above or below their respective individual trend lines (%M/A). A break below, represented by a negative number, shows weakness, while a break above, represented by a positive percentage, shows strength.
For hundreds of ETF choices, be sure to reference Thursday’s StatSheet.
Year to date, here’s how the 2017 candidates have fared so far:
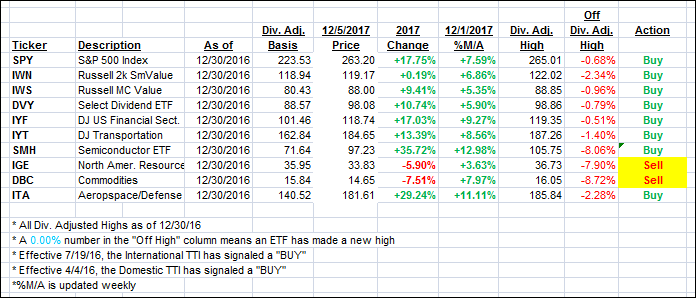
Again, the %M/A column above shows the position of the various ETFs in relation to their respective long term trend lines, while the trailing sell stops are being tracked in the “Off High” column. The “Action” column will signal a “Sell” once the -7.5% point has been taken out in the “Off High” column.
- Trend Tracking Indexes (TTIs)
Our Trend Tracking Indexes (TTIs) slipped again as the major indexes see-sawed.
Here’s how we closed 12/05/2017:
Domestic TTI: +3.14% above its M/A (last close +3.26%)—Buy signal effective 4/4/2016
International TTI: +5.13% above its M/A (last close +5.24%)—Buy signal effective 7/19/2016
Disclosure: I am obliged to inform you that I, as well as my advisory clients, own some of the ETFs listed in the above table. Furthermore, they do not represent a specific investment recommendation for you, they merely show which ETFs from the universe I track are falling within the guidelines specified.
Contact Ulli