

1. Moving the Markets
After two days of gains, it was time for a reversal. To no surprise, the culprit turned out to be another failed set of negotiations between Greece and its EU creditors. It was the Greek headlines that moved the markets to the downside, as disappointment over progress prevailed. Another meeting was scheduled for tonight…
The domestic news featured the revised GDP number for the 4th quarter to only -0.2% from a previous -0.7%, which was in line with expectations. On the earnings front, home builder Lennar (LEN) reported better than expected second quarter earnings pushing its share price up by 3.8%.
All of our 10 ETFs in the Spotlight joined the market pullback and closed lower. Holding up the best was Consumer Staples (XLP), which gave back 0.45%. The most volatility was seen in the Global 100 (IOO) as it surrendered 2.40%.
2. ETFs in the Spotlight
In case you missed the announcement and description of this section, you can read it here again.
It features 10 broadly diversified ETFs from my HighVolume list as posted every Monday. Furthermore, they are screened for the lowest MaxDD% number meaning they have been showing better resistance to temporary sell offs than all others over the past year.
Here are the 10 candidates:
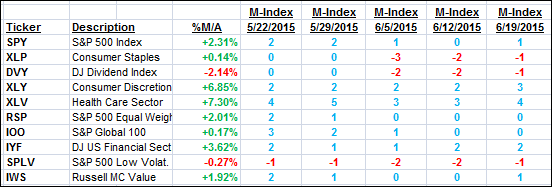
The above table simply demonstrates the magnitude with which some of the ETFs are fluctuating in regards to their positions above or below their respective individual trend lines (%M/A). A break below, represented by a negative number, shows weakness, while a break above, represented by a positive percentage, shows strength.
For hundreds of ETF/Mutual fund choices, be sure to reference Thursday’s StatSheet.
Year to date, here’s how the above candidates have fared so far:
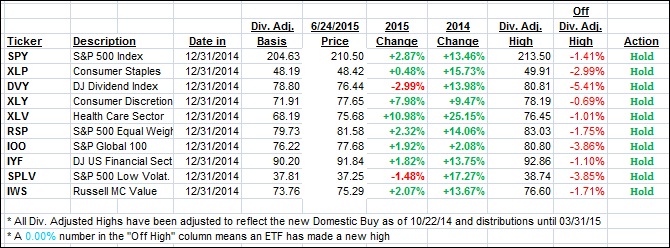
Again, the first table above shows the position of the various ETFs in relation to their respective long term trend lines (%M/A), while the second one tracks their trailing sell stops in the “Off High” column. The “Action” column will signal a “Sell” once the -7.5% point has been taken out in the “Off High” column.
3. Trend Tracking Indexes (TTIs)
Our Trend Tracking Indexes (TTIs) pulled back as the major indexes went down a black diamond slope. We ended the day as follows:
Domestic TTI: +1.98% (last close +2.33%)—Buy signal effective 10/22/2014
International TTI: +3.88% (last close +4.41%)—Buy signal effective 2/13/2015
Disclosure: I am obliged to inform you that I, as well as advisory clients of mine, own some of these listed ETFs. Furthermore, they do not represent a specific investment recommendation for you, they merely show which ETFs from the universe I track are falling within the guidelines specified.
Contact Ulli