
1. Moving the Markets
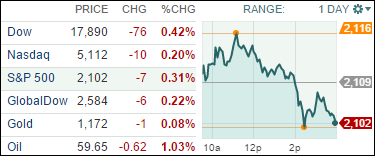
The early move to the upside turned into a dud when the usual culprits, namely Greece and the domestic economy, combined forces that gave the bear the upper hand for this session.
Also weighing on market sentiment was the miserable performance of the Dow Transportation Index, which is now down some 10% from its peak reached in late November. This index is often viewed as representative of the state of the economy.
Domestically, consumer spending shot up sharply showing the biggest gain in some 6 years and jobless claims remained at a decade low. Some of the economic reports of the recent past have shown improvement, which these days is a bad thing as it increases the chances of the Fed raising rates sooner than hoped for.
Meanwhile, it should be no surprise to you that the Greek soap opera continues with all its nuances. A Thursday morning meeting failed to generate consensus, so we’re back to square one.
9 of our 10 ETFs in the Spotlight headed south and closed lower with the Financials (IYF) suffering the most by losing 0.71%. Bucking the trend was our YTD winner, Healthcare (XLV), which managed to eke out a 0.55% gain.
2. ETFs in the Spotlight
In case you missed the announcement and description of this section, you can read it here again.
It features 10 broadly diversified ETFs from my HighVolume list as posted every Monday. Furthermore, they are screened for the lowest MaxDD% number meaning they have been showing better resistance to temporary sell offs than all others over the past year.
Here are the 10 candidates:
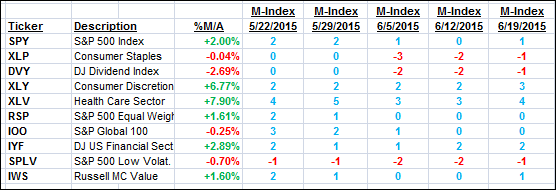
The above table simply demonstrates the magnitude with which some of the ETFs are fluctuating in regards to their positions above or below their respective individual trend lines (%M/A). A break below, represented by a negative number, shows weakness, while a break above, represented by a positive percentage, shows strength.
For hundreds of ETF/Mutual fund choices, be sure to reference Thursday’s StatSheet.
Year to date, here’s how the above candidates have fared so far:
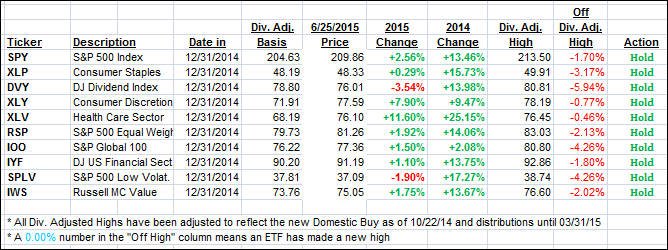
Again, the first table above shows the position of the various ETFs in relation to their respective long term trend lines (%M/A), while the second one tracks their trailing sell stops in the “Off High” column. The “Action” column will signal a “Sell” once the -7.5% point has been taken out in the “Off High” column.
3. Trend Tracking Indexes (TTIs)
Our Trend Tracking Indexes (TTIs) slipped again as bearish sentiment weight on today’s session.
Here’s how we closed:
Domestic TTI: +1.86% (last close +1.98%)—Buy signal effective 10/22/2014
International TTI: +3.75% (last close +3.88%)—Buy signal effective 2/13/2015
Disclosure: I am obliged to inform you that I, as well as advisory clients of mine, own some of these listed ETFs. Furthermore, they do not represent a specific investment recommendation for you, they merely show which ETFs from the universe I track are falling within the guidelines specified.
Contact Ulli