
1. Moving the Markets
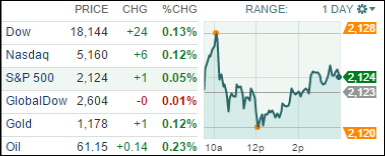
Gains are better then losses; even if they’re small! That was the case today as the major indexes hugged the unchanged line but managed to close on the plus side. The Nasdaq eked out another record as the waiting game in the Greek saga continues. More clarification is needed to see if the latest proposal to the creditors can be nailed down.
To me, it looks like the markets have priced in some kind of acceptable resolution but, of course, you can never be sure of the actual outcome. Right now the game goes on, and it will be interesting to see what market reaction will be should Greece end up leaving the EU. In my view, the impact on the domestic market may not be that great but for sure the euro and the dollar, along with European stocks, will most likely be severly affected.
Our 10 ETFs in the Spotlight were mixed as the indexes meandered without clear direction. Nevertheless, 5 of them gained with the leader being the Consumer Discretionaries (XLY) with +0.40%, while the downside was led by Consumer Staples (XLP) with -0.43%.
2. ETFs in the Spotlight
In case you missed the announcement and description of this section, you can read it here again.
It features 10 broadly diversified ETFs from my HighVolume list as posted every Monday. Furthermore, they are screened for the lowest MaxDD% number meaning they have been showing better resistance to temporary sell offs than all others over the past year.
Here are the 10 candidates:
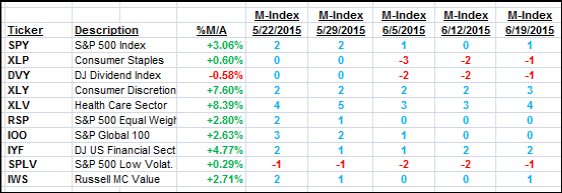
The above table simply demonstrates the magnitude with which some of the ETFs are fluctuating in regards to their positions above or below their respective individual trend lines (%M/A). A break below, represented by a negative number, shows weakness, while a break above, represented by a positive percentage, shows strength.
For hundreds of ETF/Mutual fund choices, be sure to reference Thursday’s StatSheet.
Year to date, here’s how the above candidates have fared so far:
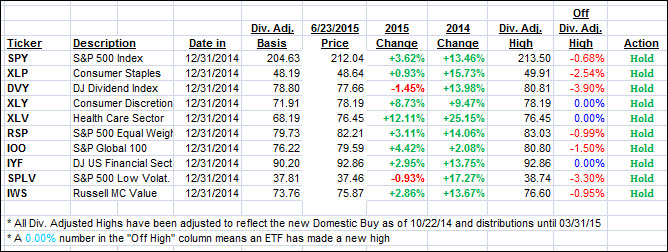
Again, the first table above shows the position of the various ETFs in relation to their respective long term trend lines (%M/A), while the second one tracks their trailing sell stops in the “Off High” column. The “Action” column will signal a “Sell” once the -7.5% point has been taken out in the “Off High” column.
3. Trend Tracking Indexes (TTIs)
Our Trend Tracking Indexes (TTIs) went nowhere and barely changed from yesterday’s close:
Domestic TTI: +2.33% (last close +2.32%)—Buy signal effective 10/22/2014
International TTI: +4.41% (last close +4.28%)—Buy signal effective 2/13/2015
Disclosure: I am obliged to inform you that I, as well as advisory clients of mine, own some of these listed ETFs. Furthermore, they do not represent a specific investment recommendation for you, they merely show which ETFs from the universe I track are falling within the guidelines specified.
Contact Ulli