ETF/No Load Fund Tracker Newsletter For Friday, March 2, 2012
ETF/No Load Fund Tracker StatSheet
————————————————————-
THE LINK TO OUR CURRENT ETF/MUTUAL FUND STATSHEET IS:
https://theetfbully.com/2012/03/weekly-statsheet-for-the-etfno-load-fund-tracker-newsletter-updated-through-03012012/
————————————————————
Market Commentary
Friday, March 2, 2012
U.S. INDEXES SNAP WINNING STREAK; XLE SLUMPS AS OIL SINKS; GAZ BURNS BRIGHT
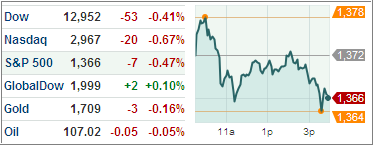
The Dow Jones Industrial Average (DJIA) snapped a three week winning streak as indexes closed lower on Friday.
Treasuries advanced for the first time in four days, as risk was off the table amid worries that measures to boost lending in the EU region and priming the region’s banks with excess liquidity will not spur growth.
The European Central Bank said overnight deposits touched record levels after the second round of LTRO on Wednesday, indicating banks are still worried about lending and prefer depositing the cash with ECB. The Fed purchased $1.97 billion in long-term securities Friday as part of Operation Twist.
There were also reports of the Federal Reserve and Wall Street banks locking horns over retaining rights on storage facilities for physical commodities such as warehouses, underground oil tanks etc. This is an important development that may result in the Fed either allowing banks more freedom in trading physical commodities, or force them to sell off storage assets altogether, dealing another blow after curbing trading with new rules.
US stocks ended marginally lower today. Energy firms led the slide among S&P 500 Index’s (SPX) 10 major sectors, as oil fell below $107 a barrel on EU growth worries. The week has witnessed multiple milestones and indices touched highs not seen since summer of 2008.
This is the Dow’s first weekly decline in three weeks.
The S&P 500 however, edged higher for the eighth time in the past nine weeks, although the index was down 0.3 percent to 1,369.63 on the day, after President Obama urged the Congress on Thursday to end $4 billion in subsidies to oil firms in an effort to check budget deficits.
The tech-laden NASDAQ Composite Index (COMP) lost 0.4 percent to end the week at 2,976.19. Both the S&P 500 and the NASDAQ finished the week higher for the fourth straight week despite today’s losses.
As worries over Europe persisted, the US 10-year yield fell 0.05 percentage point, or 5 basis points, to 1.98 percent. The Vanguard Total Bond Market ETF (BND) was up 0.20 percent over yesterday, while the iShares Barclays 20 Year Treasury Bond ETF (TLT) rose 0.93 percent for the day.
In the ETF space, the iPath Dow Jones UBS Natural Gas Subindex Total Return ETN (GAZ) made a spectacular comeback and added 6.4 percent on the day after getting hammered in the last couple of days. The gains on this ETN were, however, attributed to its massive premium.
The Guggenheim China Small Cap Index ETF (HAO) managed to move in the green territory after languishing for the last two days and added a modest 1.1 percent. This small-cap option is suited to investors looking to tap the burgeoning Chinese middle-class. I don’t track it yet in my weekly StatSheet yet, due to its fairly low volume.
Among the losers, the United States Gasoline Fund (UGA) tanked today and lost 2.2 percent after having gained over the past two days.
Energy producers were out of favor too, and the SPDR S&P Oil & Gas Exploration & Production ETF (XOP) slid nearly 2 percent during the day’s trading.
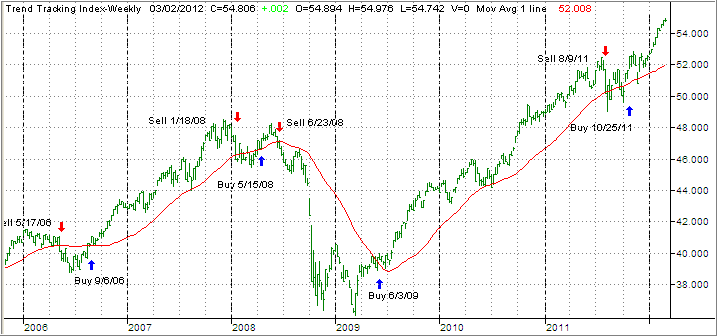
Our Trend Tracking Indexes (TTIs) remained solidly in bullish territory with the Domestic TTI being on the plus side by +5.36% while the International TTI hovers at +5.32%.
With the markets having ascended literally in a straight line, this is not the time to be complacent. Changes in trend direction can occur quickly given the volatile investment climate we are living in. Even though I have not mentioned it in a week or so, you still need to be alert and have your exit strategy in place. Doing without can be hazardous to your financial health.
Have a great week.
Ulli…
————————————————————-
READER Q & A FOR THE WEEK
All Reader Q & A’s are listed at our web site!
Check it out at:
http://www.successful-investment.com/q&a.php
A note from reader Doug:
Q: Ulli: In the Friday February 24 post you mention the “RSX” ETF was up 4.5 percent! Since you issued an international buy signal, I have been nibbling at country funds and have search for a quote on “RSX” I find two, one is “index nasdaq:rsx @$159.20” and the second “nysearca:rsx @$33.37!” Which one are you following?
A: Doug: I am only aware of one RSX, and that is the second one you mentioned.
As an aside, remember country funds/ETFs run on their own cycle and are a ‘Buy’ whenever they cross their individual trend lines. They are NOT tied to the International TTI, which covers only “broadly diversified international funds/ETFs.”
———————————————————-
WOULD YOU LIKE TO HAVE YOUR INVESTMENTS PROFESSIONALLY MANAGED?
Do you have the time to follow our investment plans yourself? If you are a busy professional who would like to have his portfolio managed using our methodology, please contact me directly or get more details at:
https://theetfbully.com/personal-investment-management/
———————————————————
Back issues of the ETF/No Load Fund Tracker are available on the web at:
https://theetfbully.com/newsletter-archives/

 US markets lost some of the sheen on Friday though performance for the week remained steady. Most of the indexes are either at a multi-year high or at sniffing distance from them. Commodities got some pounding though during the week.