7 ETF Model Portfolios You Can Use – Updated through 2/28/2012

Ulli Model ETF Portfolios, Uncategorized Contact

The markets meandered since last week’s ETF Model Portfolio update, as the Dow repeatedly bounced against overhead resistance at the 13k milestone, while the S&P 500 had trouble piercing its glass ceiling at 1,370.

Investors were finally rewarded yesterday, as both levels were conquered with the indexes closing above them. This is always a crucial moment, since continued bouncing against a resistance level can easily cause a total trend reversal.

Our model portfolios followed market direction with #3, #4 and #7 almost tracking the S&P 500 performance year to date. Whether any of them match the index or not is not as important as is having appropriate diversification, since the downside will come into play again for sure; as always, the timing of it is just the unknown

Take a look at the latest ETF Model Portfolio update:

Read More

U.S. Stocks Rise With Consumer Confidence, UNG Dips With Oil, SLV Zooms

Ulli Market Review Contact

[Chart courtesy of MarketWatch.com]

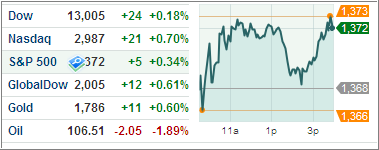
Soaring consumer confidence and falling oil prices triggered a rally in US stocks as the Dow Jones Industrial Average closed over the psychologically important 13,000 mark for the first time since May ’08.

The DJIA ended at 13,005.12, a gain of 0.2 percent, while the S&P 500 added 0.3 percent to close at 1,372.18, its highest level in four years. The NASDAQ Composite rose 20.60 points to 2,986.76, its fourth straight day of gains, and the highest level since December 2000.

Continued worry over contagion effect in the EU and U.S. notes purchased by the Federal Reserve drove yields on 10-year notes to near three-week low Tuesday. As stocks rebounded over strong consumer confidence news, Treasuries erased early gains indicating better risk appetite. Yields on 10-year notes remained near flat for the day at 1.93 percent.

Read More

US Stock Indexes Close Flat, Builder ETFs Rise As Pending Home Sales Near 2-Year High

Ulli Market Review Contact

[Chart courtesy of MarketWatch.com]

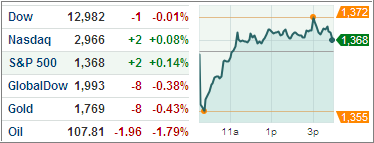
US stocks closed flat despite the domestic economy showing signs of improvement and Europe appearing less toxic. Early gains for the day, after stronger-than-expected housing data came in, were offset by a pullback in the energy sector.

The Dow Jones Industrial Average (DJIA) shed 0.01 percent, to end at 12,982 while the S&P 500 managed to add 1.9 points and closed 1,368. The NASAQ Composite added 2.4 points to Friday’s close to settle at 2,966.

The energy sector was down 0.4 percent as oil prices retraced from the $110 a barrel mark to pare previous gains.

Stocks were falling in early trade as reports of G20 ministers rebuffing Germany’s call for higher resources for the Eurozone appeared overnight. The Group of 20 countries said Europe must strengthen their financial firewall before other nations commit more money to the International Monetary Fund.

The G20 is planning to create bailout funds worth $2 trillion with $1 trillion from Europe’s temporary (EFSF) and permanent funds (ESM) and about $500 billion for the IMF.

Read More

ETFs/Mutual Funds On The Cutline – Updated Through 2/24/2012

Ulli ETFs on the Cutline Contact

Below are the latest ETF Cutline reports, which show how far above or below their respective long-term trend lines (39 week SMA) my currently tracked ETFs/MFs are positioned.

The first report covers the ETF Master List from Thursday’s StatSheet and includes 398 ETFs, of which currently 360 (last week 353) of them are hovering in bullish territory.

The second report includes only High Volume ETFs. To clarify, High Volume (HV) ETFs are defined as those with an average daily volume of $10 million or higher.

These ETFs are generated from my selected list of some 93 that I use in my advisor practice. It cuts out the “noise,” which simply means it eliminates those ETFs that I would never buy because of their volume limitations. 79 ETFs (last week 74) have managed to move into in bullish territory after the recent run up.

The third report covers Mutual Funds on the Cutline. There are currently 815 (last week 808) above the line and 46 below it out of the 861 that I follow.

Take a look:

1. ETF Master Cutline Report

2. ETF High Volume Cutline Report

3. MF Cutline Report

Last Week In Review: ETF News And Blog Posts To 2/26/2012

Ulli Market Review Contact

In case you missed it, here’s a summary of the ETF topics and market reviews I posted to my blog during the week ending on 2/26/2012.

Meandering with an upside bias best describes the trend of the past week. The major indexes have reached a crucial point which, if broken to the upside, could mean further advances and confirmation of the current bull market. The milestones are 1,370 for the S&P 500 and 13,000 for the Dow.

If momentum weakens, and these hurdles are not overcome, the downside could come into play again, which should not be surprising given the fact that we have not seen a decent market pullback this year.

This week, we covered the following:

Read More

Equity Markets Are Witnessing A Rally Now. Is It Driven By Fundamentals?

Ulli Market Review Contact

Markets in the US have touched June highs since 2008, and the Dow is flirting with 13,000. Is the equity market witnessing a bull run, particularly since the start of this year? Or is the market overpriced and a pullback is imminent?

The S&P is up eight percent year-to-date and nearly 25 percent since October 2011 lows. Some of the emerging markets have recovered spectacularly and are up more than 20 percent year-to-date.

If Saira Malik, Head of Global Equity Research at TIAA-CREF, a large teacher’s retirement fund, is to be believed, the Dow is now fairly valued. The recent rally has been caused by a combination of both local and global events such as stronger manufacturing in the US, the ECB’s LTRO initiative, better investor confidence in Germany and better business surveys in China.

However, investors should cut their risk exposures to moderate levels since energy prices have shot up recently. This will affect consumer spending and profitability of companies and it has already reflected in the forward looking earnings estimates of the S&P, which has dipped to 9 percent from 11 percent.

The utilities, which tend to do well during slowdowns, have done well in the last four months. Investors can target them for better dividend yields unless markets turn extremely negative. Currently trading at 14X of forward-earnings, the S&P is fairly valued now since historically it has traded in the 12X to 18X range in the last five years.

The liquidity enhancing measures taken by the Fed in the US, by the ECB in Europe, by the BoE in England, and by the BoJ in Japan, will ensure that the markets remain well funded in near future. You can watch the full interview here.

Whether these measures will have the desired long-term positive effect remains to be seen. I view them merely as desperate band aid approaches, since the real underlying issue of too much debt anywhere you look, has not been addressed.