Dow Witnesses Biggest Fall In Three Months; VXX Soars On Higher Volatility, ERUS Sinks

Ulli Market Review Contact

[Chart courtesy of MarketWatch.com]

U.S. stocks suffered their biggest drop this year on Tuesday as fears of a disorderly Greek default loomed large.

The DJIA sank by more than 200 points after the US markets witnessed a sell-off following weak economic data from Europe and rising yields on EZ government bonds. As Greece struggles to meet Thursday’s deadline to convince private sector lenders agree to higher haircuts on their bond-holdings, many investors chose to rebalance their portfolios ahead of the cut-off date.

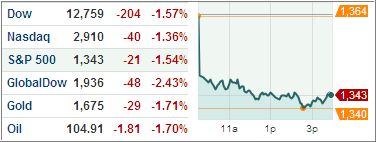
The Dow lost 1.5 percent to close at 12,759, its biggest drop since Dec. 8, when it sank 1.6 percent. The S&P 500 dropped 1.5 percent to 1343.36, its worst day since Dec. 8 and the third straight day of losses. The tech-laden NASDAQ Composite lost 1.4 percent to end at 2,910.32, also its highest percentage drop since December 8.

Read More

U.S. Stocks Decline Despite Rising Service-Sector Index; GAZ Burns Bright, KWT Slumps

Ulli Market Review Contact

[Chart courtesy of MarketWatch.com]

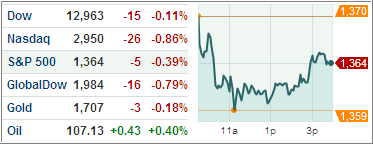
U.S. stocks ended lower Monday despite the service-sector gauge advancing in February. The Institute for Supply Management’s non-manufacturing index came in better-than-expected. However, its employment index dropped, while the inflation-measuring price index jumped in January.

Not helping the markets were the Chinese lowest growth target in eight years for 2012 and a survey that showed a shrinking European economic activity.

The Dow Jones Industrial Average shed 0.1 percent while the S&P 500 (SPX) lost 0.4 percent after natural resources retreated and consumer staples advanced. The tech-laden NASDAQ Composite was leading to the downside by dropping 0.9 percent.

Treasuries fell after U.S. service industries’ index recorded its fastest growth in a year, reinforcing the domestic recovery theory.

Read More

03-05-2012

Ulli Newsletter Archives Contact

The ETF/No Load Fund Tracker—Monthly Review—February 29, 2011

Major Market ETFs Maintain Upward Momentum

February started on a strong note after some January economic reports came in stronger than expected, driving both the DJIA and the S&P 500 to multi-month highs. The NASDAQ went on to touch its best level in a decade.

Fed Chairman Bernanke testified before the House of Representatives Budget Committee, and his statement that the economy is susceptible to shocks surprised no one. Even as Greece struggled with the second bailout round, concerns over Europe and domestic economic outlook were on the decline, he noted.

The gridlock over Greece spilled to the markets next week as aggressive selling was witnessed on Monday and ensuing losses made sure markets booked losses, snapping a streak of five weekly gains. However, by Thursday the market had accumulated modest gains made on Tuesday and Wednesday and the S&P 500 ended at its highest level in seven months.

Domestic upward momentum affected the international arena as well, as our International Trend Tracking Index (TTI) finally crossed its long-term trend line to the upside and generated a ‘Buy’ signal for that area effective February 8. I took the opportunity to add VEU (Vanguard All World-ex. U.S. index) for some clients, while for others I already had covered that slot with a couple of well performing country ETFs.

As uncertainties over Iran continued, oil prices continued to climb before closing at a multi-month high of $109.76 per barrel. The rise in oil prices drove the CRB Index 2.7 percent higher for the week. Along with Tech stocks, Utilities, Energy, Healthcare and Consumer Staple advanced while Financials and Telecom declined.

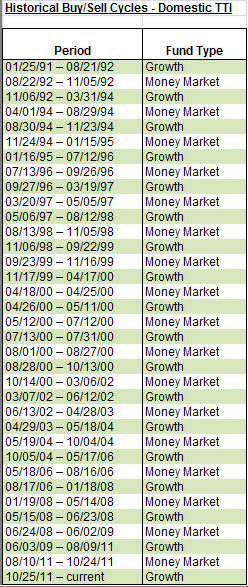
The final week saw some action with commodities tumbling though the S&P 500 managed to end the week higher for the eighth time in nine weeks. Our Domestic Trend Tracking Index (TTI) followed suit and has been ascending in a straight line since the beginning of the year (red arrow), as the chart below shows:
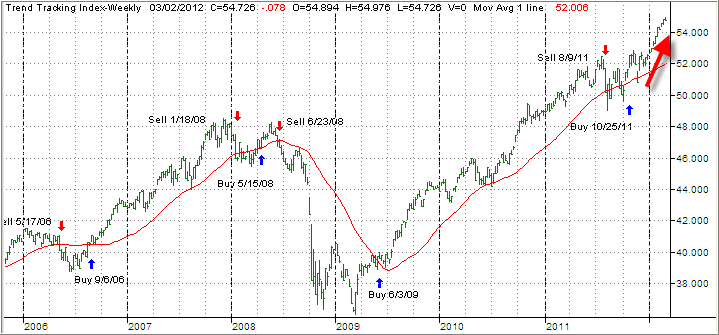
It’s glaringly obvious that this steep ascent can’t continue, because it has been supported primarily by loose monetary policy. Sooner or later some reality has to set in, and the question remains in my mind as to how much of a setback the markets will have to deal with.

While no one has that answer, or knows the timing of it, it simply pays to be alert to any directional changes, and I am prepared to deal with them via our trailing sell stops designed to limit downside risk.

In the meantime, Fed Chairman Bernanke delivered his semiannual monetary policy report on the last working day of the month. Though his observations weren’t surprising, his skipping a reference to future quantitative easing (QE3) definitely surprised many.  It seems to me that QE3 had been priced in the market and any lack thereof, along with possible weakening economic numbers, could very well be the impetus to end this euphoric rally all of a sudden.

ETFs/Mutual Funds On The Cutline – Updated Through 3/2/2012

Ulli ETFs on the Cutline Contact

Below are the latest ETF Cutline reports, which show how far above or below their respective long-term trend lines (39 week SMA) my currently tracked ETFs/MFs are positioned.

The first report covers the ETF Master List from Thursday’s StatSheet and includes 398 ETFs, of which currently 365 (last week 360) of them are hovering in bullish territory.

The second report includes only High Volume ETFs. To clarify, High Volume (HV) ETFs are defined as those with an average daily volume of $10 million or higher.

These ETFs are generated from my selected list of some 93 that I use in my advisor practice. It cuts out the “noise,” which simply means it eliminates those ETFs that I would never buy because of their volume limitations. 80 ETFs (last week 79) have managed to move into in bullish territory after the recent run up.

The third report covers Mutual Funds on the Cutline. There are currently 818 (last week 815) above the line and 43 below it out of the 861 that I follow.

Take a look:

1. ETF Master Cutline Report

2. ETF High Volume Cutline Report

3. MF Cutline Report

Last Week In Review: ETF News And Blog Posts To 3/4/2012

Ulli Market Review Contact

In case you missed it, here’s a summary of the ETF topics and market reviews I posted to my blog during the week ending on 3/4/2012.

The major indexes drifted sideways but maintained their slightly upward bias from the prior week.

I would expect this churning to continue until a new driver emerges to push this market higher. A host of upcoming economic reports may influence market direction, but for sure Friday’s unemployment numbers are bound to make a statement.

If they turn out to be disappointing, we may see the long awaited pullback. Should they show further improvement, however, this could ignite upward momentum and push the major market ETFs further north.

This week, we covered the following:

Read More

The Economic Indicators Continue To Impress, Time For Celebrations?

Ulli Market Commentary Contact

Data released by the government this week indicates the economy has started performing and the ghost of the subprime crisis has been (allegedly) buried at last. The confidence in the economy has been reinforced to some degree by Fed Chairman Ben Bernanke’s refusal to initiate another round of quantitative easing (QE3). Is the economy on a true recovery path? Can we look forward to a better year in 2012 with a healthy GDP expansion as economic indicators continue to show resilience?

If Wall Street Journal Reporter Ben Casselman is to be believed, the recovery has started. The initial jobless claim is trending downwards for several weeks now and currently stands at 8.3 percent. Developments in the jobs market will continue to indicate an economic recovery. The jobless claims and the number of jobs added, though correlated, sometimes tend to travel in opposite directions. While the jobless claims number tells us if people are losing jobs, they don’t tell us if new jobs are being created.

Sometime last year we had witnessed new jobs being created, but the jobless claims never really came down. So it was not clear if people were simply leaving the job market rather than finding new jobs. The difference this time is that job growth appears to have been consistent according to reports and some 900,000 new jobs have been added in the last five months. Though this number is not definitive, it still indicates that the job market is getting healthier.

Read More