Equities Leak Higher On Data; Europe Rises On Earnings

Ulli Market Commentary Contact

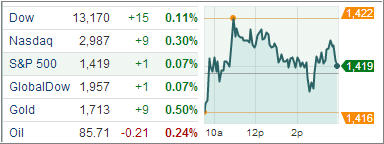
[Chart courtesy of MarketWatch.com]

US equities snapped a two-day losing streak to end modestly higher as investors weighed better economic data against average corporate earnings report.

Economic data offered the silver lining after two day’s of hammering. Demand for durable goods jumped 9.9 percent in September, a Commerce Department report revealed.

Also, first time jobless claims came in better than expected, falling by 23,000 to 369,000 in the week ended Oct 20, a Labor Department report showed.

A third report showed pending-home sales rose 0.3 percent in September after a sharp fall in the prior month.

Risk sentiment got a boost after China’s Ministry of Industry and Information Technology said factory output is expected to grow at a faster pace in the final quarter of 2012, while preliminary data from the UK showed the country’s GDP grew by 1 percent in the third quarter, the fastest in five years.

Read More

Skidding To Seven-Week Low As Fed Decision Offsets Economy; Europe Rises On PMI Data

Ulli Market Commentary Contact

[Chart courtesy of MarketWatch.com]

Giving out early session gain gains, US stocks finished lower Wednesday as the Federal Reserve’s call for modest growth tempered moods amid signs of improvement in Chinese factory output and American housing market.

October US flash manufacturing activity notched up to 51.31 from 51.1 in September while the US housing industry continued to chug ahead, extending gains in September. A Commerce Department report revealed new-home sales jumped 5.7 percent to a 389,000 annual pace in September, the highest since April 2010.

Also, the initial HSBC China Manufacturing Purchasing Managers Index rose to 49.1 in October from 47.9 in September, a three-month high that indicated the economic contraction may have bottomed out in the country, adding to the temporary “soft landing” theory.

Read More

7 ETF Model Portfolios You Can Use – Updated through 10/23/2012

Ulli Model ETF Portfolios Contact

Last week’s rebound attempt lasted exactly 2 days before the bears stepped in and pulled the indexes off their lofty levels with the S&P 500 giving back some 2.9% since last Tuesday’s model portfolio posting.

Some reality in regards to earnings and outlooks has finally set in as some of the bellwether companies disappointed. Throw in the fact that a global slowdown is underway, accompanied by no progress in the eurozone debt debacle, and it becomes clear that equities have gotten way ahead of themselves.

Oh, I almost forgot, soon we will face the upcoming battle about the debt ceiling and the fiscal cliff, which means all of a sudden even more uncertainties are staring Wall Street traders in the face.

That makes it crucial that we watch our trailing sell stops and/or any directional changes to the Trend Tracking Indexes (TTIs) so that we can stay ahead and sneak through the exit doors in time to avoid serious portfolio damage.

Here’s the latest update to our ETF Model Portfolios:

Read More

Exuberance Disappears As Markets Take It On The Chin; Europe Plunges

Ulli Market Commentary Contact

[Chart courtesy of MarketWatch.com]

Stocks took another plunge today with the Dow Industrials hitting a seven-week low after a batch of weak US earnings numbers and worries over Spain deepened investors concern of a global slowdown.

Risk sentiment soured after ratings agency Moody’s Investor service downgraded Spain’s five regions by one or two notches stating their long term funding alternatives remained uncertain while cash reserves were limited.

After a 262-point fall, the Dow Jones Industrial Average (DJIA) closed 243 points lower, posting its biggest daily drop since June 21. Breadth within the Dow turned negative with all but two of the blue-chip index’s 30 stocks finishing lower.

The S&P 500 Index (SPX) gave back 21 points, the lowest since Sep. 5 with commodities and financials pacing the losses and all of its 10 business groups finishing lower for the day.

Read More

Last Hour Lift-A-Thon Saves The Day; Europe Turns Lower

Ulli Market Commentary Contact

[Chart courtesy of MarketWatch.com]

US market indexes staged a late-session comeback Monday that erased early losses to end marginally higher after the technology sector rallied to lift major equity averages.

It was the usual afternoon lift-a-thon we have become accustomed to witness now that the Fed is officially in charge of stock market direction.

Following last week’s steep losses after disappointing earnings results by Google and Microsoft, the tech sector bounced back Monday to finish about 1/3 percent higher.

Despite losing 108 points in early trade, the Dow Jones Industrial Average (DJIA) managed to add 2 points while the S&P 500 Index (SPX) added less than a point with information technology outperforming the index and energy, telecom and consumer discretionary faring the worst among its 10 business groups.

After falling below the 3,000 level in intraday trade for the first time since August 13, the NASDAQ Composite Index (COMP) erased losses to finish 11 points higher at 3017.

Read More

ETFs/Mutual Funds On The Cutline – Updated Through 10/19/2012

Ulli ETFs on the Cutline Contact

Below are the latest ETF Cutline reports, which show how far above or below their respective long-term trend lines (39 week SMA) my currently tracked ETFs/MFs are positioned.

The first report covers the ETF Master List from Thursday’s StatSheet and includes 398 ETFs, of which currently 339 (last week 335) of them are hovering in bullish territory.

The second report includes only High Volume ETFs. To clarify, High Volume (HV) ETFs are defined as those with an average daily volume of $10 million or higher.

These ETFs are generated from my selected list of some 93 that I use in my advisor practice. It cuts out the “noise,” which simply means it eliminates those ETFs that I would never buy because of their volume limitations. 80 ETFs (last week 75) have managed to remain in bullish territory after the recent market volatility.

The third report covers Mutual Funds on the Cutline. There are currently 756 (last week 766) above the line and 106 below it out of the 861 that I follow.

Take a look:

1. ETF Master Cutline Report

2. ETF High Volume Cutline Report

3. MF Cutline Report

In case you are not familiar with some of the terminology used in the reports, please read the Glossary of Terms.