ETF/No Load Fund Tracker Newsletter For Friday, December 13, 2013
ETF/No Load Fund Tracker StatSheet
————————————————————-
THE LINK TO OUR CURRENT ETF/MUTUAL FUND STATSHEET IS:
https://theetfbully.com/2013/12/weekly-statsheet-for-the-etfno-load-fund-tracker-newsletter-updated-through-12122013/
————————————————————
Market Commentary
Friday, December 13, 2013
STOCKS STILL WAVERING UPON FED DECISION
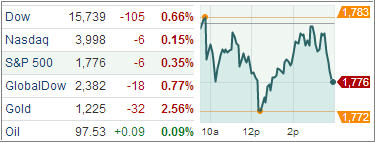
[Chart courtesy of MarketWatch.com]
1. Moving The Markets
Stocks had a mixed close on Friday as investors were cautious after a three-day drop and ahead of the Federal Reserve’s final policy meeting of the year next week. Stronger-than-expected American retail sales data during the week, coming after last week’s forecast-beating jobs report, have increased speculation that the Fed will start winding down its stimulative bond purchases soon. That would reduce the incentive that helped to drive global equities in recent months.
Such concerns have led United States-based funds to withdraw $6.51 billion from stock mutual funds in the last week, the biggest outflow this year, before the Fed’s two-day meeting next week
Emerging markets were also hit this week, with sell-offs in currencies — including the Indian Rupee and Japanese Yen — on concern that tighter Fed policy could sap flows of money into emerging markets and push up borrowing costs there. The prospects for a stronger dollar have in turn hit metals and oil, by making them more expensive for buyers outside the United States.
In the ETF world, materials and Industrials led the ETF herd today posting 0.48% and 0.30% gains respectively. Clearly markets are getting short-term oversold but Friday brought us little economic data leaving us the weekend to ponder the way ahead. Monday and Tuesday should be tense affairs before the FOMC announcement.
With the markets meandering, our ETFs in the spotlight retreated from their yearly highs:
2. ETFs in the Spotlight
In case you missed the announcement and description of this section, you can read it here again.
It features 10 broadly diversified ETFs from my HighVolume list as posted every Monday. Furthermore, they are screened for the lowest MaxDD% number meaning they have been showing better resistance to temporary sell offs than all others over the past year.
In other words, none of them ever triggered their 7.5% sell stop level during this time period, which included a variety of severe market pullbacks but no move into outright bear market territory.
Here are the 10 candidates:
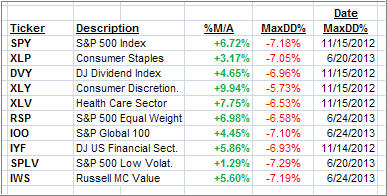
All of them are in “buy” mode meaning their prices are above their respective long term trend lines by the percentage indicated (%M/A).
Now let’s look at the MaxDD% column and review the ETF with the lowest drawdown as an example. As you can see, that would be XLY with the lowest MaxDD% number of -5.73%, which occurred on 11/15/2012.
The recent sell off in the month of June did not affect XLY at all as its “worst” MaxDD% of -5.73% still stands since the November 2012 sell off.
A quick glance at the last column showing the date of occurrences confirms that five of these ETFs had their worst drawdown in November 2012, while the other five were affected by the June 2013 swoon, however, none of them dipped below their -7.5% sell stop.
Year to date, here’s how the above candidates have fared so far:
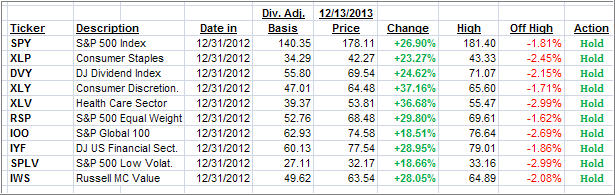
This week’s sell off pulled all of our ETFs off their highs, but only modestly so considering the run up they’ve experienced YTD.
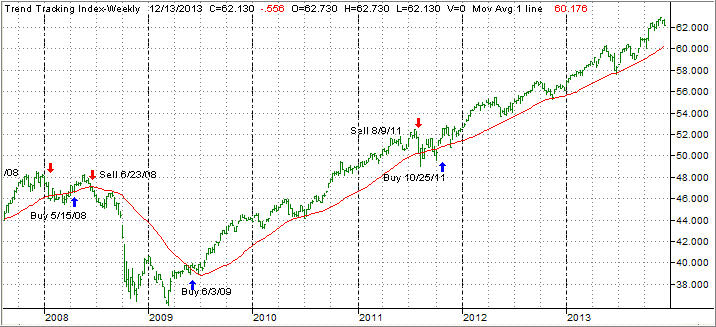
3. Domestic Trend Tracking Indexes (TTIs)
Looking at the big picture, our Trend Tracking Indexes (TTIs) retreated with the overall negative tone in the market. However, they remain above their long term trend lines by the following percentages:
Domestic TTI: +3.31% (last Friday +4.34%)
International TTI: +4.45% (last Friday +5.96%)
Have a great week.
Ulli…
Disclosure: I am obliged to inform you that I, as well as advisory clients of mine, own some of these listed ETFs. Furthermore, they do not represent a specific investment recommendation for you, they merely show which ETFs from the universe I track are falling within the guidelines specified.
————————————————————-
READER Q & A FOR THE WEEK
All Reader Q & A’s are listed at our web site!
Check it out at:
http://www.successful-investment.com/q&a.php
A note from reader Mike:
Q: Ulli: What is the difference between the “DD%” and the “trailing stop loss %”?
A: Mike: The DD% refers to the percentage a fund has come off its high. This is the high a fund has made since you purchased it, and it serves as a basis for calculating the trailing sell stop. For example, let’s assume you bought an ETF for $10 and it subsequently moves as follows for the next trading days: 10.05, 9.98, 10.15, 10.21, 10.30, 10.19, 10.14…
The high it has made in this data series is 10.30, which becomes the basis for calculating your 7.5% trailing sell stop, which would be at 9.52. If prices sink through 9.52, without taking out the high of 10.30 first, that would be your trigger point to exit the position.
In my weekly StatSheet listings, you can see the percentage a fund has come off its high in the DD% column. Once that number exceeds -7.5%, it means a sell signal for that fund has been generated. To be clear, if you bought this fund at a different time than shown in the StatSheet, you need to track your own highs (no pun intended) as mentioned above.
Hope this clarifies it.
———————————————————-
WOULD YOU LIKE TO HAVE YOUR INVESTMENTS PROFESSIONALLY MANAGED?
Do you have the time to follow our investment plans yourself? If you are a busy professional who would like to have his portfolio managed using our methodology, please contact me directly or get more details at:
https://theetfbully.com/personal-investment-management/
———————————————————
Back issues of the ETF/No Load Fund Tracker are available on the web at:
https://theetfbully.com/newsletter-archives/

 Investors in 2014 need to rotate from some of the defensive parts of the equity market into some of the more cyclical, said Andrew Goldberg, Global Market Strategist at JP Morgan Asset Management.