1. Moving The Markets
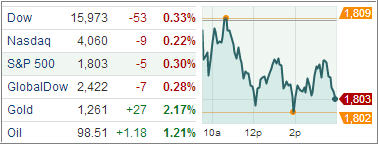
Domestic Equities posted their largest drop in a month, with traders locking in recent gains after a provisional budget deal out of Washington. The bipartisan budget agreement reached late Tuesday would end three years of political confrontations and fiscal instability in Washington. The final Fed policy statement of the year is expected on December 18, at the end of a two-day meeting. It seems as we head toward the end of FY2013 that people are more concerned about locking in profits in positions that have had big gains this year.
In one of the few items of market-moving news on Wednesday, Costco’s (COST.O) profit missed Wall Street’s estimates because of higher stock-based compensation expenses and spending on technology. Its shares fell 1.2 percent to close at $118.57.
The euro rose for a seventh straight session against the dollar on Wednesday, driven by higher money market rates and a growing belief that the European Central Bank will keep interest rates low for some time but not cut them. The euro is at a six-week high and within striking distance of its best level versus the dollar in over two years. However, the euro zone still faces a long road to recovery, given the recent weak economic data, particularly in France.
ETF’s ended mostly in the red today with only Consumer Staples bucking the trend and showing gains of 0.16%. Facebook will join the S&P 500 on Dec. 20th. Facebook’s entry into the S&P 500 means the stocks will soon be found in some of the largest ETFs, including the largest in the world, the $166.1 billion SPDR S&P 500 (SPY) and the $51.2 billion iShares Core S&P 500 ETF (IVV).
All of our ETFs in the Spotlight slipped with the exception of Consumer Staples (XLP), which closed on the plus side: