
1. Moving The Markets
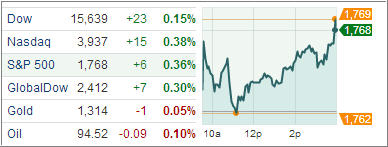
U.S. stocks rose, after the S&P 500 Index climbed for four straight weeks, as Exxon Mobil Corp. and U.S. Steel Corp. led a commodity rally while investors awaited data on employment and economic growth. All major indexes gained as the chart above shows. About 5.7 billion shares changed hands, the slowest trading in two weeks.
Look for a healthy market in the two months to close out 2013. The S&P 500’s return has been positive over November and December every year since the bull market began in 2009. While earnings growth is slowing and the Federal Reserve is planning to curtail stimulus, it usually doesn’t pay to fight the trend in stocks. Let us also not forget that the Fed policy makers decided last week to maintain the $85 billion in monthly bond purchases.
Let’s review the new ETF section below:
2. ETFs in the Spotlight
In case you missed the announcement and description of this section, you can read it here again.
It features 10 broadly diversified ETFs from my HighVolume list as posted every Monday. Furthermore, they are screened for the lowest MaxDD% number meaning they have been showing better resistance to temporary selloffs than all others over the past year.
In other words, all of them never triggered their 7.5% sell stop level during this time period, which included a variety of severe market pullbacks but no move into outright bear market territory.
Here are the 10 candidates:
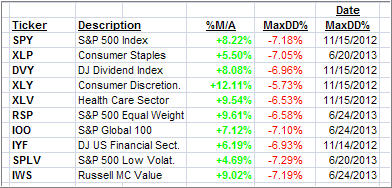
All of them are in “buy” mode meaning their prices are above their respective long term trend lines by the percentage indicated (%M/A).
Now let’s look at the MaxDD% column and review the ETF with the lowest drawdown as an example. As you can see, that would be XLY with the lowest MaxDD% number of -5.73%, which occurred on 11/15/2012.
The recent sell off in the month of June did not affect XLY at all as its “worst” MaxDD% of -5.73% still stands since the November 2012 sell off.
A quick glance at the last column showing the date of occurrences confirms that five of these ETFs had their worst drawdown in November 2012, while the other five were affected by the June 2013 swoon, however, none of them dipped below their -7.5% sell stop.
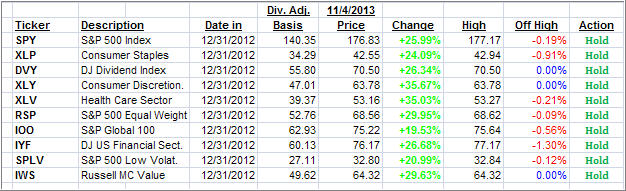
Year to date, here’s how the above candidates have fared so far:
3. Domestic Trend Tracking Indexes (TTIs)
Trend wise, our Trend Tracking Indexes (TTIs) edged higher and remain above their long term trend lines as follows:
Domestic TTI: +4.60%
International TTI: +7.55%
Disclosure: I am obliged to inform you that I, as well as advisory clients of mine, own some of these listed ETFs. Furthermore, they do not represent a specific investment recommendation for you, they merely show which ETFs from the universe I track are falling within the guidelines specified.
Contact Ulli
Comments 2
Ulli:
Thanks for all the work you put into publishing the High Volume List.
Am I correct in understanding if an investor applies a 7.5% stop, it is based on the most recent high close because you have already adjusted for prior dividends since 12/31/12?
John,
As I have posted before, you need to track your own high points from the time you purchased an ETF and adjust for dividends thereafter. That is especially important if dividends are being paid throughout the year.
Ulli…