Markets Calm After Extended Holiday

Ulli Market Commentary Contact

Mon pic

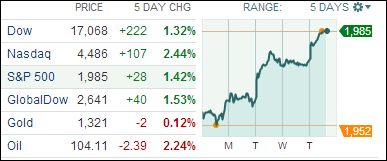
[Chart courtesy of MarketWatch.com]

1. Moving The Markets

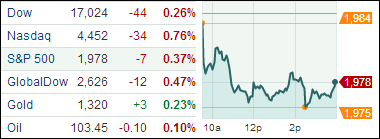
Well, last week ended with a ‘bang’ heading into the 4th of July holiday as the Dow officially passed the 17,000 mark, and the other major indexes both pushed to record highs. The momentum seemed to have fizzled after a long weekend though and the indexes closed Monday lower across the board as the chart above shows.

While there was no one major piece of news that pulled markets lower today, the buzz around the various news studios is that investors secured profits from last week and pulled back a bit today in anticipation of Q2 earnings announcements that will begin funneling in this week. The new earnings season begins Tuesday with results from aluminum producer Alcoa Inc. (AA). We’ll also hear from Wells Fargo & Co. (WFC) on Friday.

Major airlines stocks took a hit today after the TSA announced new security measures that say all electronic devices travelling into the U.S. would need to have power in order to travel, including tablet computers and cell phones, which could impact the number of passengers able to travel. United Continental (UAL) fell 3% to $38.62, Delta (DAL) fell 4.5%, to $36.90 and American Airlines (AAL) fell 4% to $40.10.

Our 10 ETFs in the Spotlight pulled back, and no new highs were made today.

Read More

ETFs/Mutual Funds On The Cutline – Updated Through 07/03/2014

Ulli ETFs on the Cutline Contact

Below are the latest ETF Cutline reports, which show how far above or below their respective long-term trend lines (39 week SMA) my currently tracked ETFs/MFs are positioned.

The first report covers the ETF Master List from Thursday’s StatSheet and includes 398 ETFs, of which currently 392 (last week 394) are hovering in bullish territory.

The second report includes only High Volume ETFs. To clarify, High Volume (HV) ETFs are defined as those with an average daily volume of $10 million or higher.

These ETFs are generated from my selected list of some 97 that I use in my advisor practice. It cuts out the “noise,” which simply means it eliminates those ETFs that I would never buy because of their volume limitations. 91 ETFs (last week 92) have managed to remain in bullish territory after the recent market volatility.

The third report covers Mutual Funds on the Cutline. There are currently 811 (last week 786) above the line and 39 below it out of the 850 that I follow.

Take a look:

1. ETF Master Cutline Report     

2. ETF High Volume Cutline Report

3. MF Cutline Report

In case you are not familiar with some of the terminology used in the reports, please read the Glossary of Terms.

If you missed the original post about the Cutline approach, you can read it here.

One Man’s Opinion: Certain Sectors In The Economy Are Heating Up While Others Are Falling Behind

Ulli Market Review Contact

92835431The biggest scar from the Great Recession is going to be a smaller labor force and less investment in the US, but it will be an expansion from the previous so-called new normal level, said Alan Krueger, an economics professor at the Princeton University and former Chairman of council of economic advisers.

Asked to comment on Janet Yellen’s speech at an IMF-led gathering on July 2, Alan said Yellen’s speech was substantive and the depth she went into with her speech was impressive. She rightly said macro-prudential relation is the first tool when it comes to fighting bubbles/imbalances in the financial sector. She couldn’t have been clearer on the matter, he noted.

Asked if Yellen believed the Fed can’t fix bubbles, Alan answered in negative because the Fed is a major regulator. Yellen talked about both underwriting and capital standards, where the Fed plays a major role. The Fed can put in speed bumps that the system needs. On monetary policy, she said interest rate hikes were the last resort to prevent bubbles from forming, he argued.

Read More

New ETFs On The Block: JP Morgan Diversified Return Global Equity ETF (JPGE)

Ulli International ETFs Contact

91551549JP Morgan Asset Management, one of the largest issuer of mutual funds in the US, ventured into the fast growing exchange-traded funds space by launching the JP Morgan Diversified Return Global Equity ETF (JPGE) on the NYSE Arca.

The launch of this much-anticipated geographically diversified “smart beta” equity fund is expected to build on JPM’s reputation as an active asset manager and has been designed to make clients feel confident during periods of heightened market volatility.

JPGE follows the FTSE Developed Diversified Factor Index, yet maintains a quasi active tilt to outperform traditional market-cap-weighted index funds. Meant to be a global core equity play for investors, it is based on the premise that market-cap weighted single-factor indexes expose investors to greater risks due to a systemic bias toward overvalued stocks.

Read More

07-05-2014

Ulli Newsletter Archives Contact

The ETF/No Load Fund Tracker

Monthly Review—June 30, 2014

US Stocks End Quarter Higher; Europe Logs Gain For The Fourth Straight Quarter

US equities extended their winning streak in June, finishing the second quarter on a high note although all the three leading indexes finished a tad short of fresh records.

The Dow Jones Industrial Average ended up 1.9 percent for the month and 2.2 percent for the quarter. The blue-chip index added a modest 1.5 percent for the first half of 2014.

The S&P 500 closed at 1,960.19, adding 1.9 percent for June. The benchmark index logged gains for a fifth straight month and rose 4.7 percent over the quarter, the biggest second-quarter gain since 2009.

The NASDAQ Composite Index closed out at 4,408.18, picking up 3.9 percent for June. The tech-heavy index rose nearly five percent for the quarter.

Although the broader US economy showed signs of improvement, there were areas of concern that indicated recovery continues to remain uneven. Financial market reaction seemed confused, apparently torn between the first quarter’s weak economic data and the seeming rebound in the second quarter.

The US job market made a strong comeback in the second quarter, leading the economy’s recovery. Data released by the Labor Department showed the economy added 288,000 jobs in June following a 224,000 gain the prior month. The jobless rate dropped to 6.1 percent, the lowest since September 2008. However, looking under the hood, the data was far from being overwhelming as 500,000 fulltime jobs were lost and some 800,000 part time jobs were gained, which is not exactly a positive trend.

The housing market also picked up pace with an improving labor market. The index of pending home sales published by the National Association of Realtors jumped 6.1 percent in May to an eight-month high of 103.9. Low mortgage rates, bigger inventory and an improving labor market will fuel future growth, the NAR report observed. A reading of 100 equals the average deal-activity level of 2001.

US home prices rose 1.1 percent in April, marking a second month of gains, the S&P/Case-Shiller’s 20-city composite index showed. On a seasonally-adjusted basis, the gain was a more moderate 0.2 percent across the 20 cities tracked, compared with March’s gain of 1.2 percent.

Consumer sentiment jumped to the highest level in more than six years in June, a report by the Conference Board showed. The consumer confidence index rose to 85.2 in June from a downwardly revised 82.2 the prior month, the highest since January 2008.

Factory output also expanded in June, indicating a sustained recovery in manufacturing. The Institute for Supply Management’s manufacturing index came in at 55.3 last month, little changed from May’s five-month high reading of 55.4.

On the downside, The Institute for Supply Management’s Chicago Business Barometer fell to 62.6 from 65.5 as new orders declined in June. While readings above 50 signal growth over previous months, June’s reading missed economists forecast of a reading above 64.

Gross domestic product in the first quarter shrank by an annualized 2.9 percent, the Commerce Department said June 25. US consumer spending, which accounts for more than two-thirds of the economy, rose 0.2 percent in May, falling short of forecasts.

Across the Atlantic, the Stoxx Europe 600 index ended the month at 341.86. The pan-European index rose 2.3 percent in the three months through June, marking its fourth straight month of gains.

The European Central Bank announced rate cuts in June to mitigate risks of a downward price spiral. Bank deposit rates were lowered to minus 0.1 percent while refinance rates were cut to 0.15 percent, aimed at boosting lending by the region’s commercial banks. The central bank also announced additional measures for targeted lending to small and medium enterprises and added it would begin preparations related to an asset-purchase plan shortly.

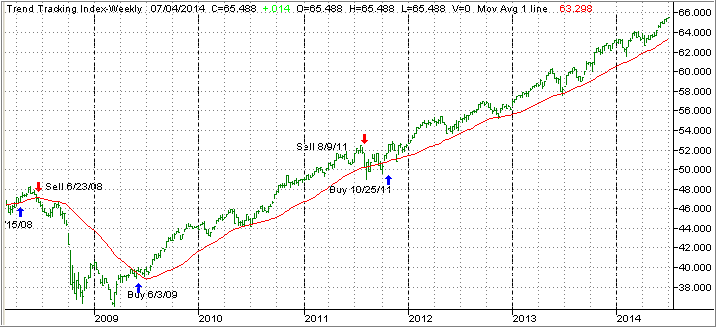
Our main directional indicator, the Domestic Trend Tracking Index (TTI) rose with the major indexes and made new highs in June:
TTI-month

The TTI (green line) is now positioned +3.65% above its long term trend line (red), which means we are solidly entrenched in bullish territory. While there have been numerous at time embarrassing predictions as to what the markets will do, it’s best to stick with the long-term trend and take evasive action once a reversal occurs.

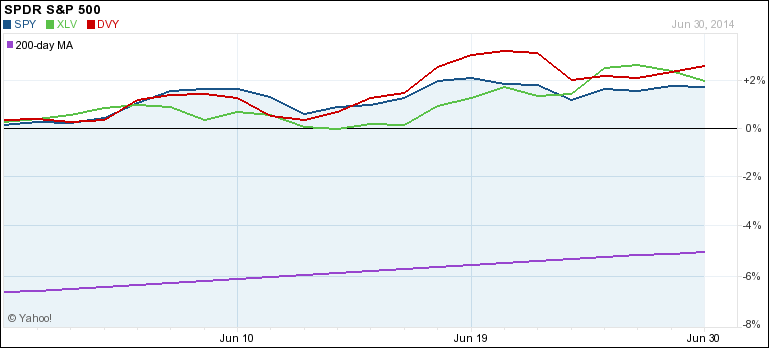
Our core holdings held pretty steady during June, as any pullbacks were not only minor but also short lived:
MonthlyChart

DVY and XLV showed the most movement and, in the end, DVY managed to beat the other 2 holdings by a slight margin.

It’s no secret that the primary driver for this continued bullishness is the Fed policy, especially low interest rates. If you think that these markets have reached bubble territory, you are correct. However, that does not mean a correction is imminent, but it certainly will happen at some point.

Right now, we will enjoy the ride as long as it lasts with our trailing sell stops providing the downside safety net should the current euphoria come to an end all of a sudden.

07-03-2014

Ulli Newsletter Archives Contact

ETF/No Load Fund Tracker Newsletter For July 3, 2014

ETF/No Load Fund Tracker StatSheet

————————————————————-

THE LINK TO OUR CURRENT ETF/MUTUAL FUND STATSHEET IS:

https://theetfbully.com/2014/07/weekly-statsheet-for-the-etfno-load-fund-tracker-newsletter-updated-through-07032014/

————————————————————

Market Commentary

Thursday, July 3, 2014

IT’S ALL ABOUT THE DOW HEADED INTO 4TH OF JULY HOLIDAY

Thur chart

[Chart courtesy of MarketWatch.com]

“The Dow finally did it!!” is what news headlines were screaming today. For the first time in history the Dow climbed and closed above the 17,000 mark. After coming within 2 points of 17,000 on Tuesday, the Dow finally cracked the 17,000 level after the government reported that a better-than-expected 288,000 jobs were created last month and the unemployment rate dipped to 6.1%, its lowest level since September 2008. Of course, these are just surface numbers. It’s been conveniently overlooked that we actually lost 500,000 full time jobs and gained some 800,000 part time jobs in the last month; truly a sad direction.

For the week, the Dow rose 1.3%, the S&P 500 advanced 1.25% and the Nasdaq climbed 2%.

Thursday’s gains were broad, with nine of the 10 primary S&P 500 sector indexes rising for the day. The only negative group was utilities, down 1.1%. The utilities sector (which has performed relatively well so far this year) is now struggling as the June jobs data suggested that the Federal Reserve may raise interest rates earlier than had previously been anticipated. Remember that investors favor utilities in a low interest-rate environment because the sector is a dividend play.

Let’s see if the markets can pick up where they left off after the 4th of July holiday.

Our 10 ETFs in the Spotlight gained for the week with 5 of them making new highs for the day.

2. ETFs in the Spotlight

In case you missed the announcement and description of this section, you can read it here again.

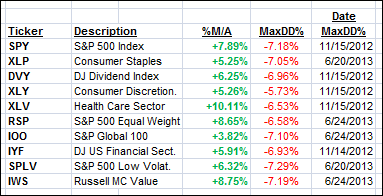
It features 10 broadly diversified ETFs from my HighVolume list as posted every Monday. Furthermore, they are screened for the lowest MaxDD% number meaning they have been showing better resistance to temporary sell offs than all others over the past year.

In other words, none of them ever triggered their 7.5% sell stop level during this time period, which included a variety of severe market pullbacks but no move into outright bear market territory.

Here are the 10 candidates:

MaxDD

All of them are in “buy” mode, meaning their prices are above their respective long term trend lines by the percentage indicated (%M/A).

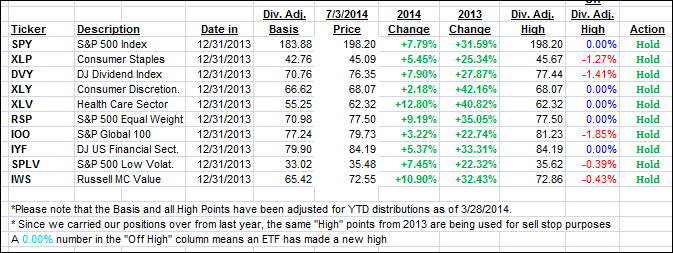
Year to date, here’s how the above candidates have fared so far:

YTD

To be clear, the first table above shows the position of the various ETFs in relation to their respective long term trend lines (%M/A), while the second one tracks their trailing sell stops in the “Off High” column. The “Action” column will signal a “Sell” once the -7.5% point is taken out in the “Off High” column.

3. Domestic Trend Tracking Indexes (TTIs)

Our Trend Tracking Indexes (TTIs) followed the bullish tendency and close the week higher:

Domestic TTI: +4.21% (last Friday +3.68%)

International TTI: +5.20% (last Friday +4.66%)

Happy 4th of July!

Ulli…

Disclosure: I am obliged to inform you that I, as well as advisory clients of mine, own some of these listed ETFs. Furthermore, they do not represent a specific investment recommendation for you, they merely show which ETFs from the universe I track are falling within the guidelines specified.

————————————————————-

READER Q & A FOR THE WEEK

All Reader Q & A’s are listed at our web site!
Check it out at:

http://www.successful-investment.com/q&a.php

A note from reader David:

Q: Ulli: Do your performance figures for ETF’s in the Spotlight assume reinvestment of cash dividends? Either way, how do you adjust performance figures to accurately reflect the gain?

A: David: For simplicity sake, I use dividend adjusted prices for the basis as the YTD table shows. Therefore, dividends are not reinvested, and the performance displayed represents the change in prices only for the period shown.

———————————————————-

WOULD YOU LIKE TO HAVE YOUR INVESTMENTS PROFESSIONALLY MANAGED?

Do you have the time to follow our investment plans yourself? If you are a busy professional who would like to have his portfolio managed using our methodology, please contact me directly or get more details at:

https://theetfbully.com/personal-investment-management/

———————————————————

Back issues of the ETF/No Load Fund Tracker are available on the web at:

https://theetfbully.com/newsletter-archives/