
1. Moving The Markets
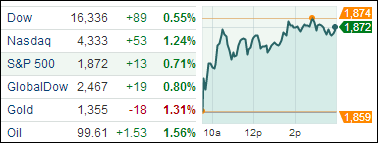
The markets continued their upward trend from Monday, as the chart above shows, with all major indexes ending on the plus side.
The big news today included a surge in U.S. food prices on the horizon, Russia annexing Crimea, and a Microsoft swell to near-record levels not seen since 2000.
The Wall Street Journal reports that retail U.S. food prices may increase as much as 3.5% this summer, threatening to exacerbate an already-tepid economic recovery. Prices are set to increase for multiple staples, including coffee, vegetables, and meat. The price increase would be the largest in three years, as international demand rises and the California drought continues to affect supplies.
This morning, Russian President Vladimir Putin signed a treaty to place the Ukrainian region of Crimea under Moscow’s domain over objections from U.S. President Barack Obama and a number of leaders in Europe. Russia will take control of the region, which is of cultural and military importance to the world’s largest nation. This news today seemed to sooth investor anxiety over escalated tensions between the two countries.
Shares of Microsoft Corp. (MSFT) gained 3.94% today. The jump comes after reports emerged that new CEO Satya Nadella will unveil an iPad app on March 27. The release will be Nadella’s first public appearance since his January appointment and will center on Microsoft’s “mobile first, cloud first” strategy that will be the hallmark of the CEO’s tenure. The last time that Microsoft hit $40 was in July 2000.
Our 10 ETFs in the Spotlight followed upward momentum with 7 of them showing gains YTD while 2 of them made new highs again.
2. ETFs in the Spotlight
In case you missed the announcement and description of this section, you can read it here again.
It features 10 broadly diversified ETFs from my HighVolume list as posted every Monday. Furthermore, they are screened for the lowest MaxDD% number meaning they have been showing better resistance to temporary sell offs than all others over the past year.
In other words, none of them ever triggered their 7.5% sell stop level during this time period, which included a variety of severe market pullbacks but no move into outright bear market territory.
Here are the 10 candidates:
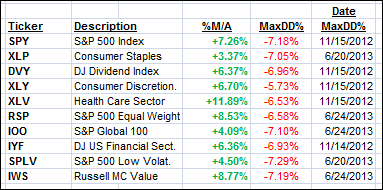
All of them are in “buy” mode meaning their prices are above their respective long term trend lines by the percentage indicated (%M/A).
Year to date, here’s how the above candidates have fared so far:
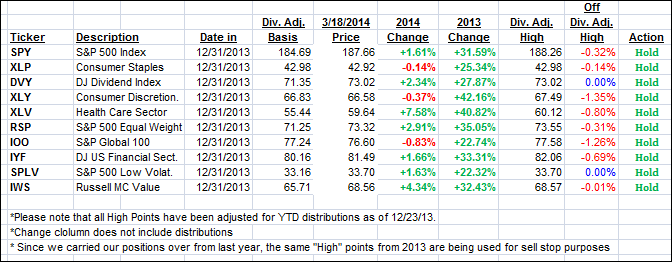
To be clear, the first table above shows the position of the various ETFs in relation to their respective long term trend lines (%M/A), while the second one tracks their trailing sell stops in the “Off High” column.
3. Domestic Trend Tracking Indexes (TTIs)
Our Trend Tracking Indexes (TTIs) rallied with the indexes and ended the day as follows:
Domestic TTI: +4.20% (last close +3.73%)
International TTI: +4.50% (last close +3.74%)
Disclosure: I am obliged to inform you that I, as well as advisory clients of mine, own some of these listed ETFs. Furthermore, they do not represent a specific investment recommendation for you, they merely show which ETFs from the universe I track are falling within the guidelines specified.
Contact Ulli
Comments 2
Ulli, (%m/a) is there a % that is higher than you are comfortable with, ie. the xlv is 11.89% above its trend, so would one think it would come down some, to a average % range above the trend. In other words, is there more risk (even though it is a buy) the higher the (%m/a) is? Do some of these etf have a range they are usually above the trend?
Duffy,
The %M/A shows me how strong the upward momentum is for a fund like XLV (which I own) compared to others. Strong momentum also means that this ETF has risen higher above its long term trend line. There is no average range that I have found that might give you a better entry point.
This is why I apply the trailing sell stop discipline in order to avoid waiting for XLV to break below its long-term trend line (it’s now almost 12% above it) before it generates a sell signal. If the markets head south and take XLV with it, I would sell it after it has come 7.5% off its high, as shown in the daily update, and not until it breaks its long term trend line. That gives me a better handle on controlling downside risk.
That also means I have reduced my current risk to almost zero, since XLV has gained 7.58% for the year, and I have owned it for quite some time.
Ulli…