
1. Moving The Markets
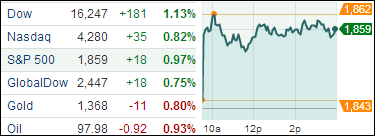
U.S. equities climbed today, with the S&P 500 bouncing from its worst weekly drop in the past seven, as concerns eased over the situation in Crimea, while economic data indicated the economy was improving after a winter slowdown. The geopolitical tension had weighed on equities last week, with the S&P 500 falling 2 percent and the CBOE Volatility index (VIX) jumping to its highest since early February on Friday.
Economically-sensitive sectors led the way higher on Monday, with both technology and industrials up 1.3 percent. Google Inc gained 1.6 percent to $1,192.10 while General Electric Co (GE) rose 1.3% to $25.43. In the latest economic data, manufacturing output recorded its largest increase in six months in February and factory activity in New York state expanded early this month. The U.S. Federal Reserve’s massive stimulus has helped keep a floor under equity prices, and I am looking ahead to the outcome of a two-day meeting of the Fed’s policy-setting committee, which begins Tuesday.
In company news, Chinese e-commerce giant Alibaba Group Holding Ltd said on Sunday it would begin the process toward a U.S. initial public offering, ending months of speculation. Shares of Yahoo Inc (YHOO), which has a 24% stake in the company, jumped 4% to $39.11, one of the best performers on the benchmark S&P index.
General Motors Co. (GM) is recalling 1.55 million vans, sedans and sport-utility vehicles, citing concerns over brakes, seat belts and air bags, adding to 1.6 million cars recalled this year due to faulty ignition switches. The automaker also said it expects about $300 million in expenses in the first quarter to cover the cost of repairs for the more than 3 million vehicles. Ouch!
Our 10 ETFs in the Spotlight rallied with 7 of them showing gains YTD while 2 of them made new highs.
2. ETFs in the Spotlight
In case you missed the announcement and description of this section, you can read it here again.
It features 10 broadly diversified ETFs from my HighVolume list as posted every Monday. Furthermore, they are screened for the lowest MaxDD% number meaning they have been showing better resistance to temporary sell offs than all others over the past year.
In other words, none of them ever triggered their 7.5% sell stop level during this time period, which included a variety of severe market pullbacks but no move into outright bear market territory.
Here are the 10 candidates:
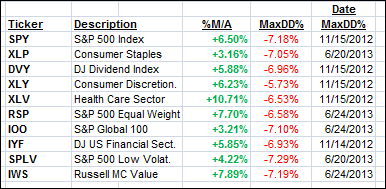
All of them are in “buy” mode meaning their prices are above their respective long term trend lines by the percentage indicated (%M/A).
Year to date, here’s how the above candidates have fared so far:
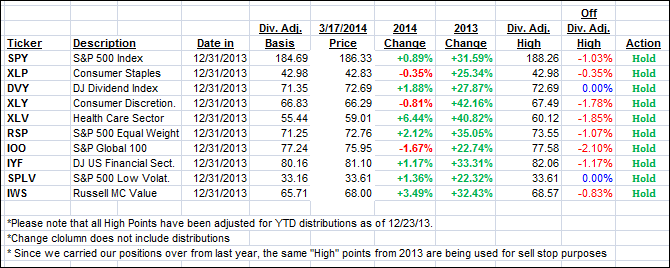
To be clear, the first table above shows the position of the various ETFs in relation to their respective long term trend lines (%M/A), while the second one tracks their trailing sell stops in the “Off High” column.
3. Domestic Trend Tracking Indexes (TTIs)
Our Trend Tracking Indexes (TTIs) recovered during today’s rally and ended as follows:
Domestic TTI: +3.73% (last close +3.34%)
International TTI: +3.74% (last close +3.10%)
Disclosure: I am obliged to inform you that I, as well as advisory clients of mine, own some of these listed ETFs. Furthermore, they do not represent a specific investment recommendation for you, they merely show which ETFs from the universe I track are falling within the guidelines specified.
Contact Ulli