1. Moving The Markets
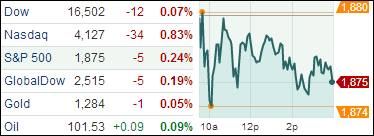
The stock market pulled back today after a solid six consecutive days of gains. The S&P 500 dropped 0.24%, the Dow finished down 0.07% and the Nasdaq led the pack dropping 0.83% on the day.
Apple (AAPL) captured headlines today after reporting that it sold 43.7 million iPhones in Q1, which was much larger than the 38 million predicted by Wall Street analysts. The company also approved a roughly 8% increase in its quarterly dividend to $3.29 per share while it also approved another $30 billion in share buybacks and authorized a 7-for-1 stock split. Shares gained 7% in after hours trading after having lost 6.95% during the regular trading day.
Corporate Q1 earnings announcements remain at the forefront of investor gaze. Today, Delta Air Lines (DAL) reported its first quarter results. The company announced an EPS of $0.33, beating the consensus estimate of $0.29. Manpower (MAN) reported its first quarter results. The company announced an EPS of $0.86, beating the consensus estimate of $0.68. Other notable earnings announcements for Q1 that topped analyst expectations came from Thermo Fisher Scientific (TMO), General Dynamics (GD), Procter & Gamble (PG), Boeing (BA), Facebook (FB) and Qualcomm (QCOM)
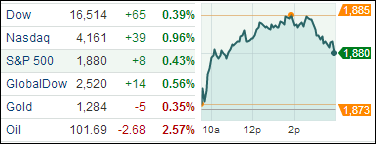
In commodities, Gold gained 0.30%, trading at $1,285 an ounce and Oil dropped 0.24%, trading at $101.51 a barrel.
Our 10 ETFs in the Spotlight zigzagged with the indexes with 9 of them remaining on the plus side YTD.