1. Moving The Markets
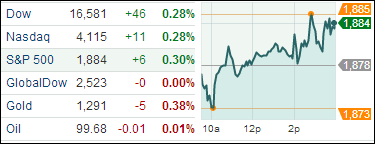
The S&P 500 ended nearly flat on Thursday as investors anxiously await Friday’s jobs report, though some gains in Internet shares helped lift the Nasdaq to positive territory late in the day. The anticipated (April) jobs report, which is expected to show that U.S. employment rose at its fastest pace in five months could give investors confidence that economic momentum will continue on through the next quarter.
Perhaps more convincing that the U.S. economy is trucking along is the fact that U.S. consumer spending recorded its largest gain in more than 4-1/2 years in March and factory activity accelerated last month. Remember that consumer spending accounts for more than two-thirds of U.S. economic activity. When adjusted for inflation, it increased 0.7% in March after advancing 0.4% in February.
Shares of DirecTV Inc (DTV) experienced a surprising pop today of 4.1% after the Wall Street Journal reported that AT&T Inc (T) had approached the company about a possible acquisition. Other gainers on the day included TripAdvisor Inc (TRIP) which added 3.4%, while Amazon.com (AMZN) rose 1.2%.
Overseas, many of the major markets were closed for May Day holidays. However, Japan’s Nikkei 225 Index jumped by 1.3% on the day, while the U.K.’s FTSE 100 Index rose by 0.4%.
Our 10 ETFs in the Spotlight went sideways; no new highs were made today but 9 of them are remaining in the green YTD.